Max Maths, Year 4, Practice, Reading and making bar graphs (2)

Maths Resource Description
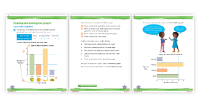
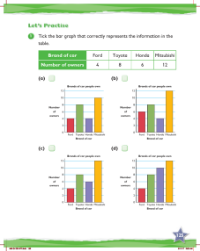
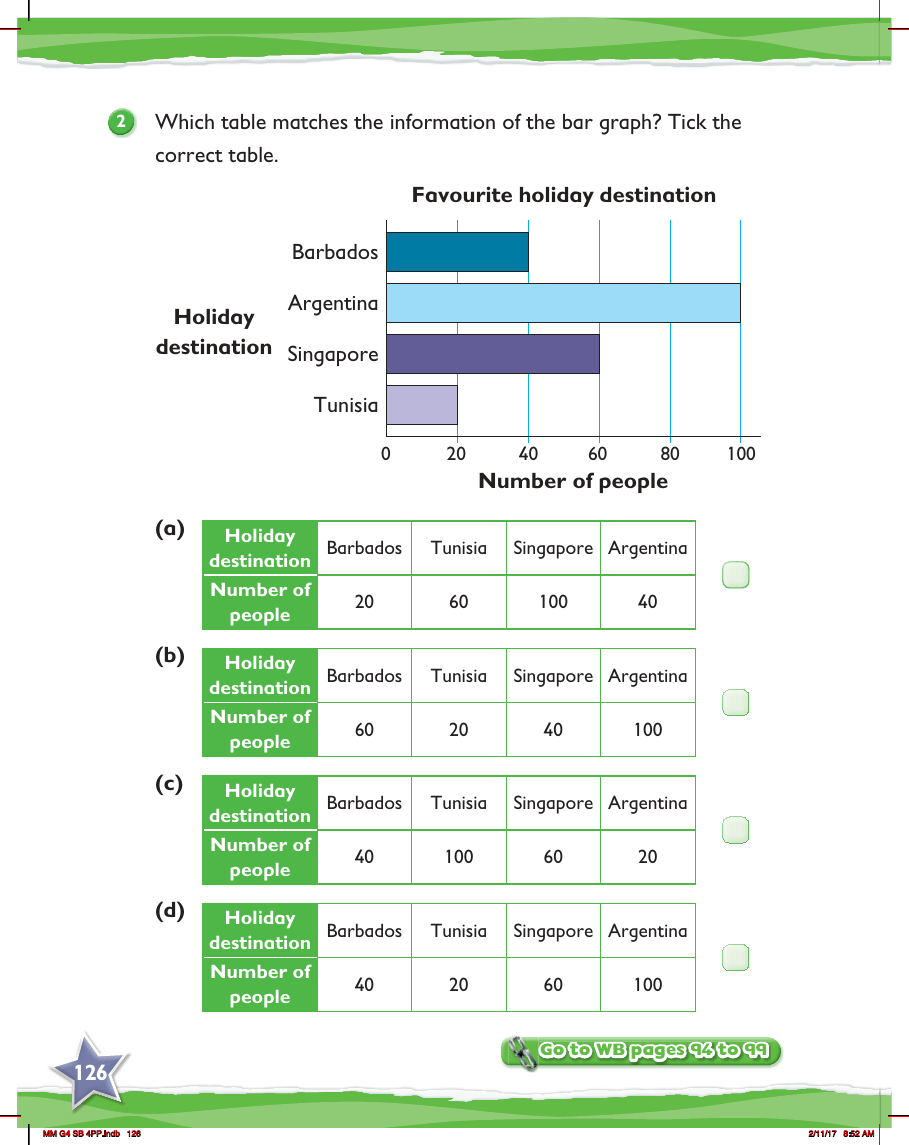
In a Year 4 mathematics lesson from Max Maths, students are presented with the engaging task of interpreting bar graphs and matching them to tabular data. The exercise involves a bar graph that displays the number of people who favour different holiday destinations, including Barbados, Argentina, Singapore, and Tunisia. The students' objective is to analyze the bar graph and identify which of the four provided tables accurately reflects the information depicted in the graph. Each table lists the same holiday destinations but presents different figures for the number of people who prefer each destination.
The students must carefully compare the heights of the bars representing each country on the graph with the numerical data in the tables. The correct table will have numbers that correspond exactly to the bar graph's representation of people's preferences. For example, if the bar for Barbados reaches up to the 80 mark on the graph, the table that lists 80 people next to Barbados would be the matching one. This exercise is designed to enhance the pupils' ability to read and interpret data from bar graphs, a fundamental skill in understanding and communicating information visually. The activity also reinforces the concept of accurate data representation and attention to detail. Students can refer to their workbooks on pages 94 to 99 for further practice and examples.