Max Maths, Year 4, Learn together, Reading and making bar graphs (3)

Maths Resource Description
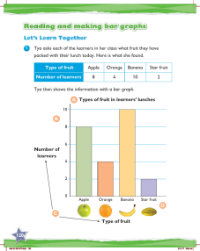
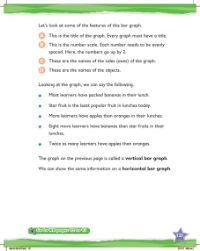
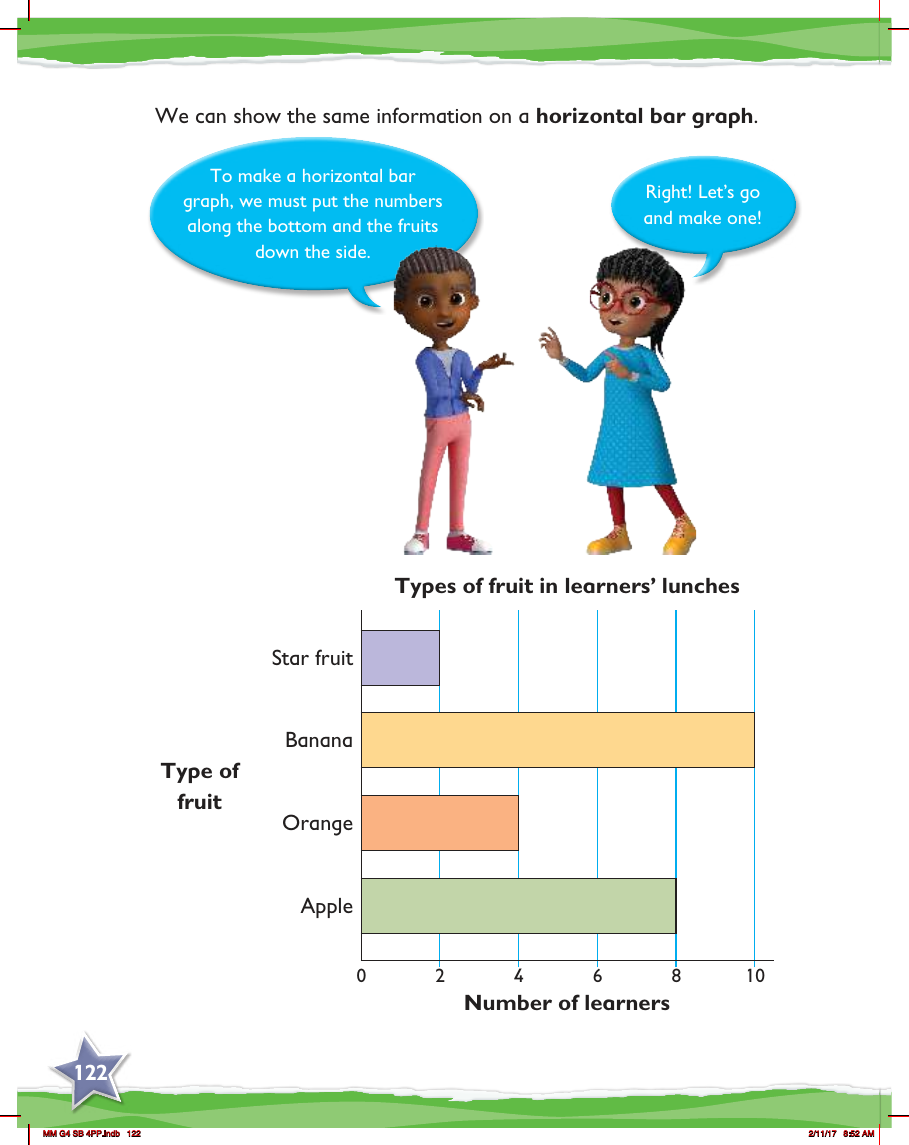
In the Max Maths Year 4 curriculum, students learn the valuable skill of interpreting and creating bar graphs. In one of the lessons, they focus on reading and making horizontal bar graphs, which is a visual way of representing data. The example used in this lesson is a survey of the types of fruit in learners' lunches. The graph is set up with the types of fruit listed vertically down the side, such as star fruit, banana, orange, and apple. Across the bottom, usually referred to as the x-axis, numbers are placed to represent the number of learners who have each type of fruit in their lunch.
Creating a horizontal bar graph involves a clear understanding of how to organise and represent data visually. Each fruit's corresponding bar runs horizontally from the name of the fruit to the right, with the length of the bar corresponding to the number of learners. For instance, if 20 learners have apples in their lunch, the bar for apples will extend to the number 20 on the horizontal scale. This method of graphing helps students to compare quantities easily and is an essential part of their mathematical literacy. By learning to make their own bar graphs, students gain hands-on experience in data handling and are encouraged to actively engage with the statistical information they encounter in their daily lives.