Max Maths, Year 4, Learn together, Reading and making bar graphs (4)

Maths Resource Description
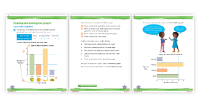
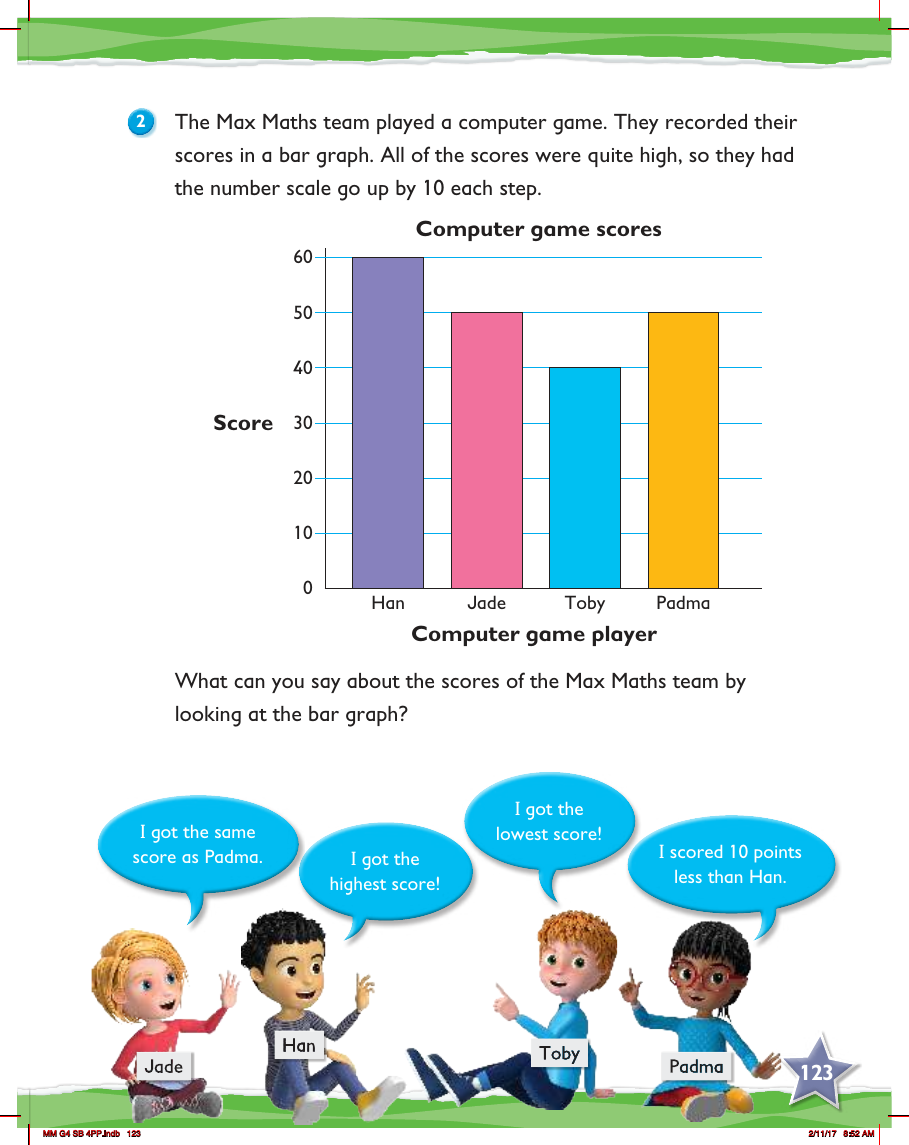
In a Year 4 mathematics lesson from Max Maths, students learn how to read and interpret bar graphs through the context of a computer game played by the Max Maths team. The team's scores are displayed on a bar graph where the vertical axis represents the scores, increasing in increments of 10. The horizontal axis lists the names of the players: Han, Jade, Toby, and Padma. By examining the graph, students can compare the scores of each player and draw conclusions about their performance in the game.
The bar graph reveals that Han achieved the highest score among the team members, while Toby's score was the lowest. Jade's score, as indicated by the height of her bar, matches that of Padma, showing that they scored equally in the game. Additionally, the graph shows that Jade scored 10 points less than Han, as her bar is one increment lower than Han's on the scale. By analysing this bar graph, students can practice their skills in reading and making inferences from graphical data, which is a key aspect of the curriculum for Year 4.