Max Maths, Year 4, Learn together, Reading and making bar graphs (2)

Maths Resource Description
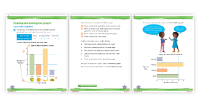
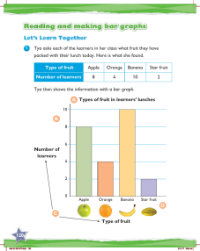
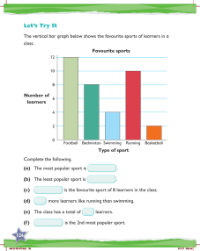
In the 'Max Maths, Year 4' curriculum, students are introduced to the concept of reading and interpreting bar graphs. One of the key lessons focuses on understanding various features that make up a bar graph. Firstly, the importance of a title is highlighted, indicating that every graph must clearly display one to describe what the graph is about. The number scale is another crucial element; it must be consistent, with numbers evenly spaced out. In this particular graph, the scale increases in increments of two. Additionally, the names of the sides, or axes, of the graph are identified, along with the labels for the objects that the graph represents.
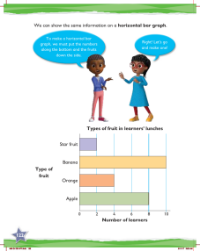
By examining the bar graph, students can deduce several pieces of information. For instance, bananas are identified as the most common fruit in learners' lunches, while star fruit is the least popular. The graph also reveals a comparison between the numbers of learners who have packed apples versus oranges, with apples being twice as popular. A specific numerical comparison shows that eight more learners have chosen bananas over star fruits. The exercise then introduces the concept of a vertical bar graph, which is the format used in this instance, and suggests that the same data can be represented using a horizontal bar graph. Students are directed to workbook pages for further practice and to consolidate their understanding of bar graphs.