Solving statistics questions worksheet
Maths Resource Description
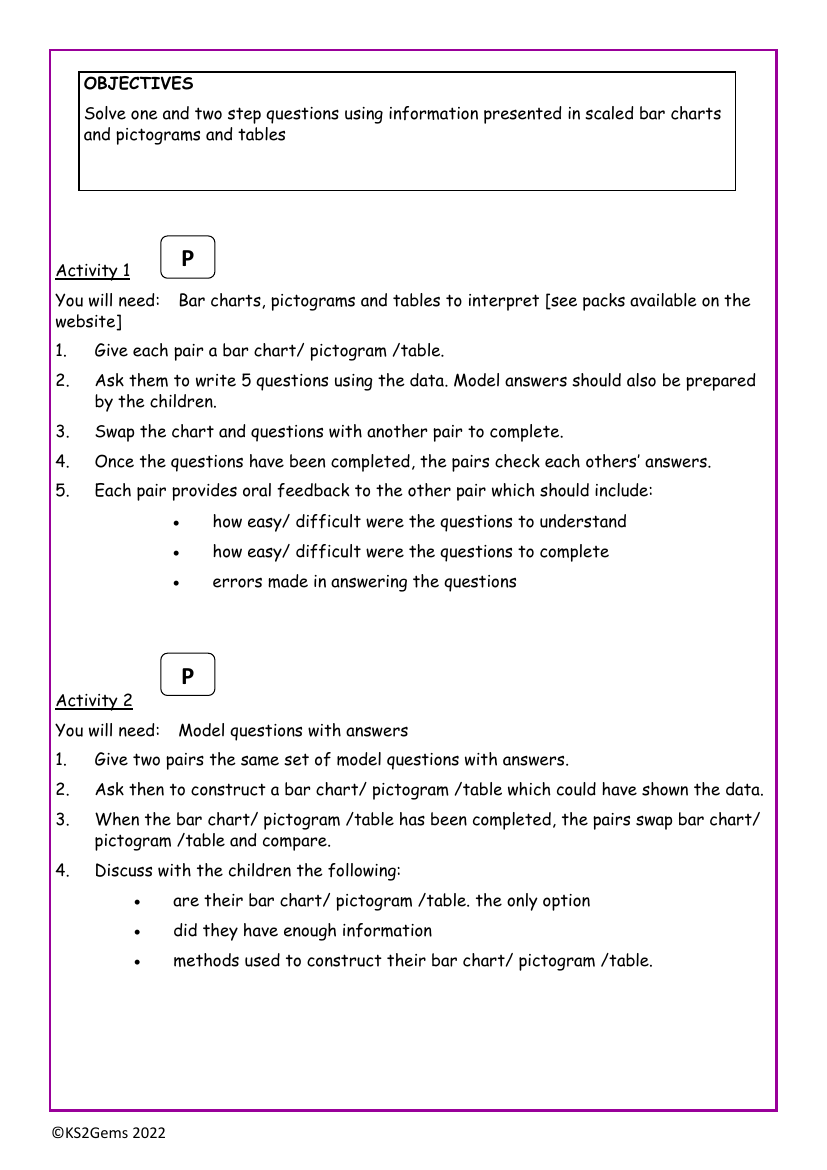
In a series of engaging activities designed by KS2Gems, Year 6 students are tasked with developing their statistical skills by interpreting and creating various data representations. Activity 1 initiates the process by providing pairs of students with bar charts, pictograms, or tables. The students are then required to devise five questions based on the data presented, along with corresponding model answers. After crafting their questions, they exchange their materials with another pair for completion. This exercise not only tests the students' understanding of the data but also their ability to evaluate the clarity and complexity of the questions they have formulated. Once the questions are answered, pairs give each other oral feedback, focusing on the difficulty level of the questions, any errors encountered, and the overall experience of completing the task.
Activity 2 builds on the previous task by giving pairs a set of model questions with answers for which they need to reverse engineer the data representation. The challenge lies in creating a bar chart, pictogram, or table that could have led to the given answers. After constructing their visual data displays, pairs swap their work and explore whether there are alternative ways to represent the same data, ensuring they had sufficient information and discussing the methods they employed. This activity encourages critical thinking about data representation and the importance of clarity in visual communication. In Activity 3, the students take a more hands-on approach by conducting a survey within their class, year group, or school. They work in small groups to collect and merge data into a tally chart or table, then use the aggregated data to create their own bar charts or pictograms. This is followed by writing and swapping questions to test each other's comprehension of the data collected. This comprehensive activity not only teaches students how to solve one and two-step questions using scaled data representations but also involves them in the entire process of data collection, representation, and interpretation, providing a holistic understanding of statistics.

