Statistics - Bar charts - Worksheet
Maths Resource Description
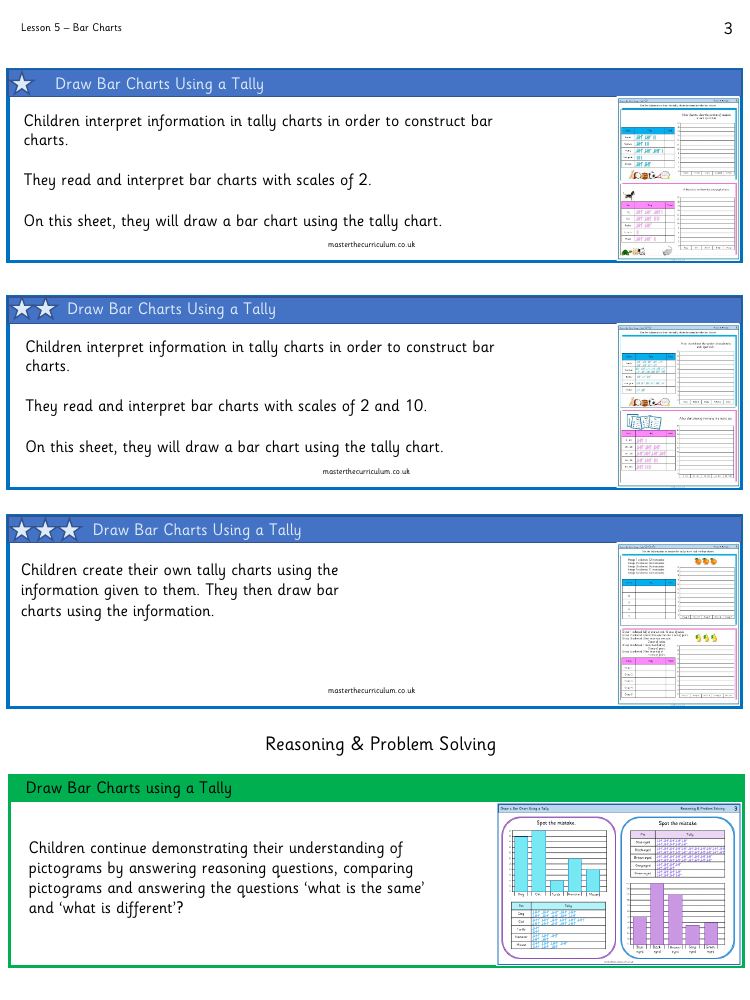
This educational resource provides worksheets for children to practice interpreting tally charts and constructing bar charts. The exercises help students learn how to read and interpret bar charts with scales of 2 and 10, and then use this information to draw their own bar charts based on provided tally charts. For example, they might be given data on the number of students participating in different sport clubs or the variety of pets owned by pupils, and from this, they are expected to complete a bar chart accurately reflecting the totals.
The worksheets extend to include reasoning and problem-solving tasks, where students must identify and correct mistakes in given bar and tally charts. These activities challenge children to apply their understanding of the data representation and ensure precision in their work. In one task, they might be given a range of sports such as tennis, football, rugby, volleyball, and cricket, with the task of creating a bar chart to show the number of students in each club. Another exercise involves tallying and charting the number of different pets owned by students. Through these engaging tasks, students enhance their fluency in data handling and develop critical thinking skills.

