Statistics - Bar charts - Planning
Maths Resource Description
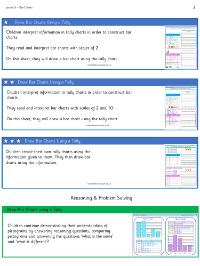
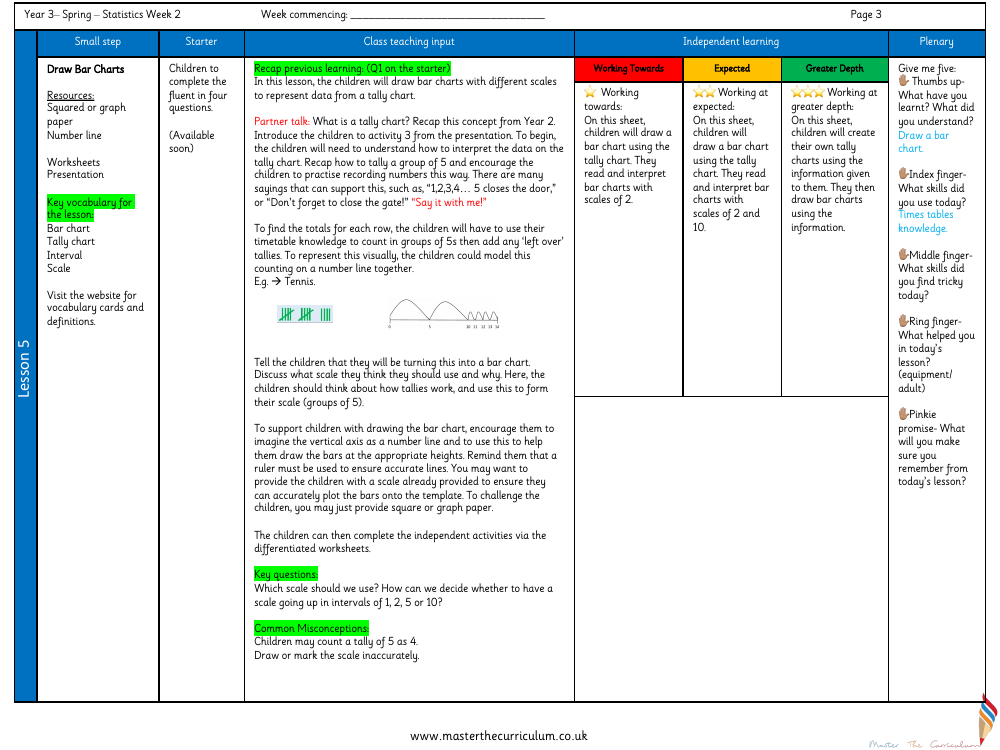
In Year 3, during the second week of Spring term statistics, students are introduced to drawing bar charts. The lesson aims to teach children how to accurately represent data from a tally chart using bar charts with varying scales. The class begins with a recap of tally charts, a concept familiar from Year 2, and progresses to interpreting tally data. Students are encouraged to practice tallying and counting in groups of five using catchy phrases to help them remember the process. They also use their times table knowledge to find totals for each row on a tally chart, with the option to use a number line as a visual aid.
Once the children understand how to interpret tally charts, they discuss the appropriate scale for a bar chart, considering the grouping in fives from the tallying method. The lesson provides resources such as squared or graph paper and a number line to support the students in drawing their bar charts. Teachers are advised to remind students to use a ruler for accuracy and may provide scales to help them plot correctly. For those ready for a challenge, only graph paper might be provided, encouraging them to determine the scale independently. The lesson includes differentiated worksheets for independent practice and concludes with a plenary session, where students reflect on what they've learned, the skills they've used, and any difficulties they encountered. The lesson plan also caters to different levels of understanding, with activities designed for those working towards expectations, at expected levels, and at greater depth.

