Statistics - Draw pictograms 1-1 - Worksheet
Maths Resource Description
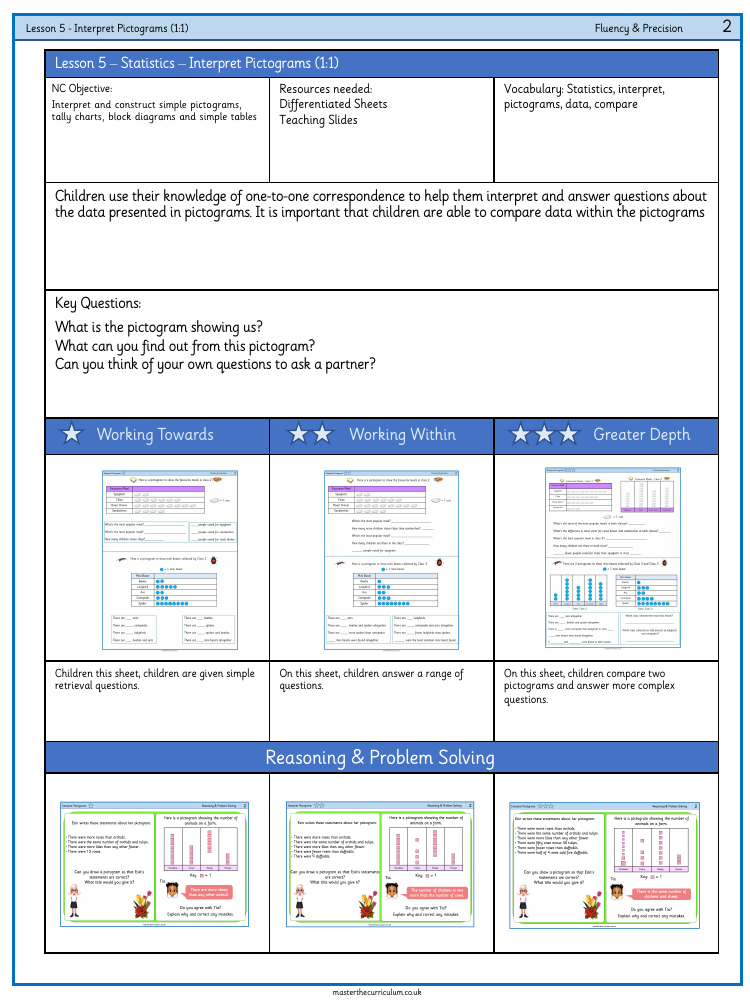
In an engaging lesson on statistics for Year 6, students are tasked with interpreting and constructing simple pictograms, with a focus on pictograms that use a one-to-one correspondence. They are provided with differentiated worksheets and teaching slides to aid their learning. The key vocabulary for this lesson includes terms such as 'statistics', 'interpret', 'pictograms', 'data', and 'compare'. The aim is for children to utilise their understanding of one-to-one correspondence to interpret data from pictograms and to formulate and answer questions regarding the data they observe. It is emphasised how crucial it is for the students to be able to compare the data within the pictograms to derive meaningful insights.
The worksheet activities vary in complexity, starting with simple data retrieval questions and progressing to more challenging tasks where students compare two pictograms and answer more complex questions. For instance, students might be asked to identify the most and least popular meals from a pictogram or to calculate the total number of mini beasts collected by a class. The exercises are designed to develop fluency and precision in interpreting pictograms, with the worksheets providing a structured approach to problem-solving and reasoning. Students are encouraged to ask and answer key questions about what the pictograms are showing and to think critically about the data presented.

