Statistics - Interpret pictograms 1-1 - Planning
Maths Resource Description
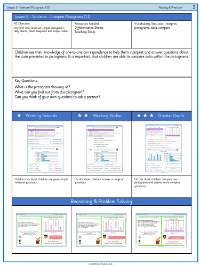
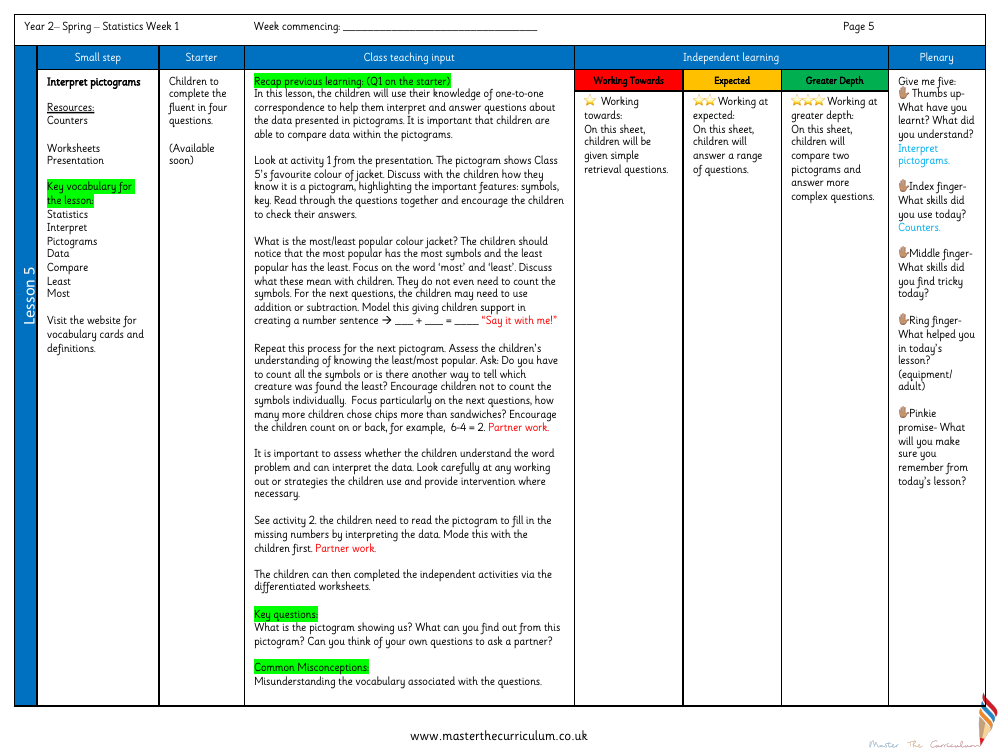
In the Year 2 statistics lesson, children are introduced to the concept of interpreting pictograms as a means of understanding and analyzing data. The lesson utilizes counters, worksheets, and a presentation as key resources, and focuses on a vocabulary list that includes terms such as 'statistics', 'interpret', 'pictograms', 'data', 'compare', 'least', and 'most'. Children are encouraged to visit the accompanying website for vocabulary cards and definitions to enhance their understanding. The lesson begins with a recap of prior learning, emphasizing the importance of one-to-one correspondence in interpreting pictograms and comparing data.
During the class, the children engage with a pictogram that represents Class 5's favourite jacket colours. They discuss the features of a pictogram, such as symbols and keys, and learn to identify the most and least popular choices without needing to count each symbol. The children are then guided to use addition or subtraction to answer more complex questions about the data, developing their problem-solving skills. Partner work is encouraged to facilitate peer learning. The lesson concludes with independent activities on differentiated worksheets, tailored to the children's varying levels of comprehension. The children reflect on what they've learned, the skills they've used, and any challenges they've faced, ensuring a comprehensive understanding of how to interpret pictograms and the vocabulary associated with them.

