Statistics - Interpret pictograms 1-1 - Starter
Maths Resource Description
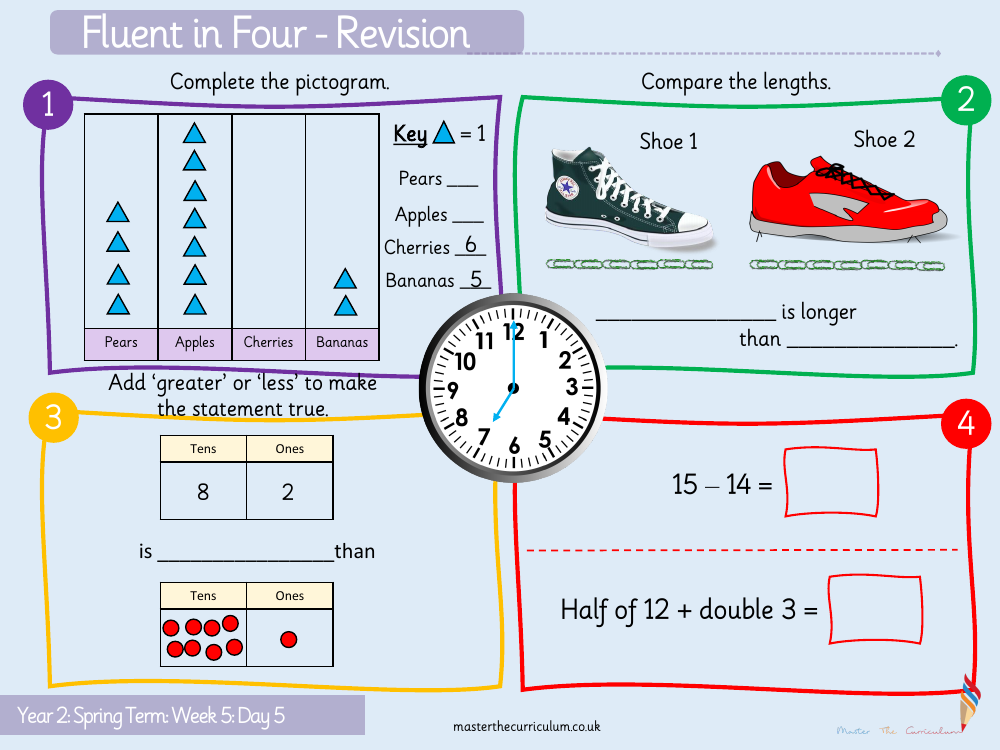
In this Year 2 mathematics lesson, part of the Spring Term curriculum for Week 5, Day 5, students are challenged with a variety of tasks to reinforce their understanding of basic arithmetic and data representation. The lesson begins with a 'Fluent in Four - Revision' exercise where students must solve simple calculations such as finding half of 12 and doubling the number 3, followed by a subtraction problem (15 - 14). This warm-up helps to consolidate their mental maths skills and understanding of basic operations.
Following the warm-up, the lesson shifts focus to interpreting data through pictograms. Students are tasked with completing a pictogram that compares different fruits—pears, apples, cherries, and bananas—with each symbol representing one unit. They must fill in the missing numbers to accurately reflect the quantities. Additionally, the lesson includes a comparison exercise where students must determine which of two shoes is longer, enhancing their ability to compare measurements. To further develop their grasp of numerical concepts, they also compare two numbers in the tens and ones format, deciding whether to use 'greater' or 'less' to make the statements true. These activities are designed to build foundational skills in interpreting data, understanding place value, and comparing quantities.

