Statistics - Make tally charts - Worksheet
Maths Resource Description
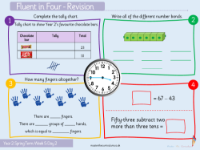
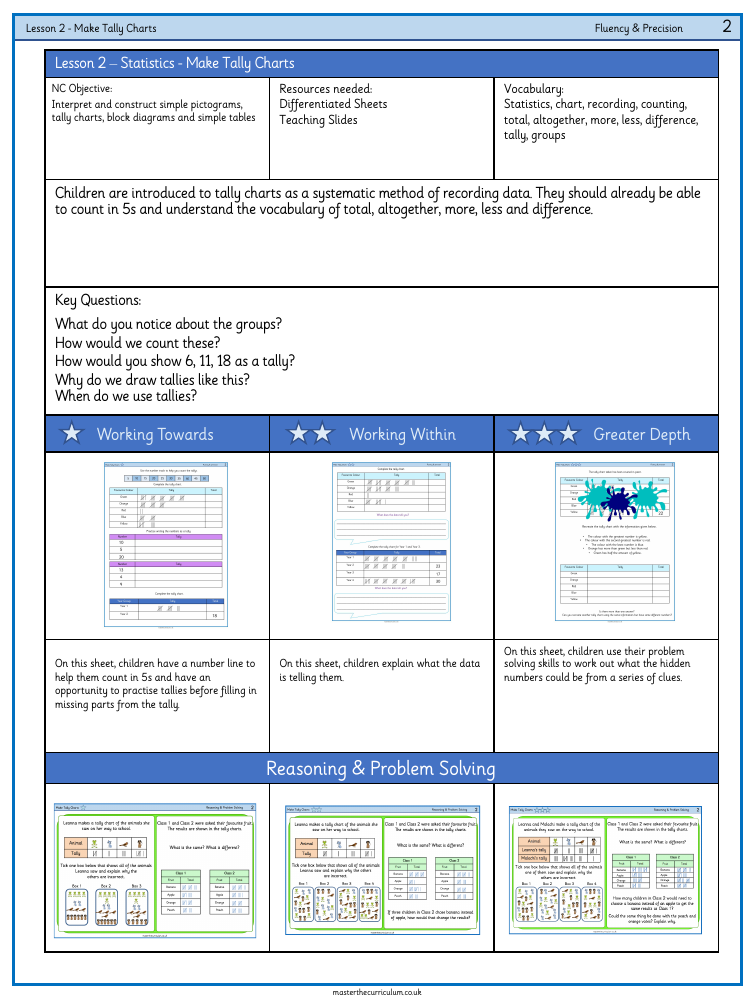
The lesson on "Statistics - Make Tally Charts" for Year 6 students is designed to help them interpret and construct various forms of data representation, such as simple pictograms, tally charts, block diagrams, and simple tables. This particular lesson focuses on tally charts, a fundamental skill in data recording and analysis. It's crucial that students are already comfortable with counting in fives and are familiar with terms such as 'total', 'altogether', 'more', 'less', and 'difference'. The lesson provides differentiated worksheets and teaching slides to accommodate varying levels of understanding. Students will practice converting numbers into tallies and use a number line to aid in counting in increments of five, enhancing their fluency and precision in data handling.
As part of their learning, students will complete tally charts, interpret data, and engage in problem-solving activities. For example, they might be asked to fill in missing parts of a tally chart, explain what the data is indicating, or deduce hidden numbers based on a set of clues. The lesson encourages reasoning as students compare data, such as favourite colours or year group preferences, and solve problems that involve recreating tally charts from partial information. To deepen their understanding, students will also explore scenarios where they must determine how a change in data (like a shift in favourite fruits among classes) would impact the results. The activities are structured to promote critical thinking and the practical application of statistical concepts in real-world contexts.

