Statistics - Make tally charts 2 - Planning
Maths Resource Description
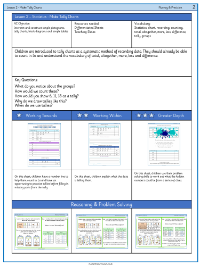
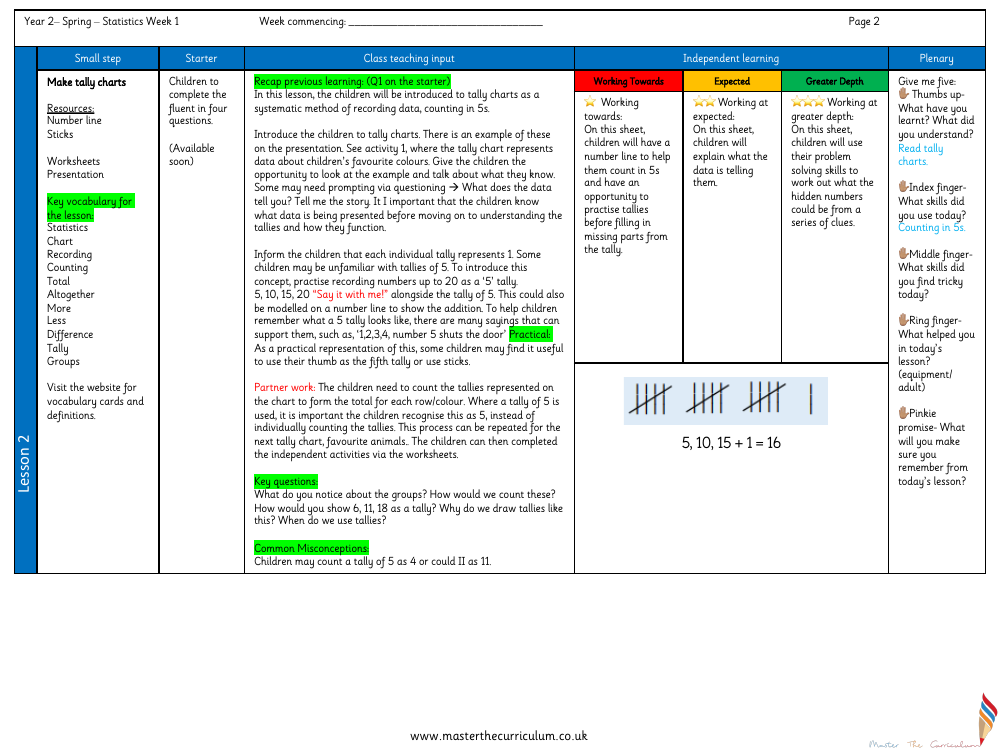
In the Year 2 curriculum, the focus for the first week of Spring term is on understanding statistics through the creation of tally charts. The lesson aims to introduce students to the concept of tally charts as a means of systematically recording and counting data. The class teaching input will guide children through an example of a tally chart, which might represent children's favourite colours, and encourage them to discuss and interpret the presented data. Key vocabulary such as 'statistics', 'chart', 'recording', 'counting', and 'tally' are introduced, with resources like number lines and sticks available to aid learning. The children will practice counting in groups of five and learn to recognise a group of five tallies as a single entity.
During partner work, the children will count the tallies on the chart and work out totals for different categories, such as favourite animals. It's essential for them to understand that a tally of five is counted as one group, rather than five individual marks. Independent learning is facilitated through worksheets designed to reinforce the lesson's objectives. The plenary involves a 'Give me five' reflection activity, where students will consider what they have learned, the skills they have used, and any challenges they faced. The lesson plan caters to different learning levels, from those working towards the expected level—using number lines and practicing tallies—to those working at greater depth, who will solve problems to deduce hidden numbers from clues, thereby enhancing their problem-solving skills.

