Statistics - Draw pictograms 2, 5 & 10 - Presentation
Maths Resource Description
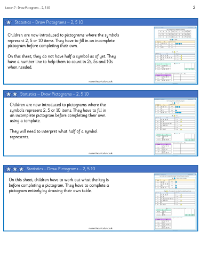
In a comprehensive lesson on drawing pictograms, students are encouraged to apply their knowledge of counting in 2s, 5s, and 10s to represent data visually. The lesson plan includes a series of activities where students learn to translate information from tally charts into pictograms. For instance, they are asked to consider how to depict one unit on a pictogram when a symbol represents two units. This concept is explored through various examples, such as types of pets, methods of transport to school, different meals, and the number of books read by each class. The activities are designed to help students understand how to effectively use pictograms to represent and interpret data.
Further into the lesson, students tackle more complex scenarios, such as representing the sales of different flavours of cakes and ice creams at school events. They must consider when it might be more efficient to use a picture to represent 10 objects instead of smaller values. The lesson also includes reasoning exercises where students compare pictograms that use different scales and orientations, discussing the similarities and differences. Independent work and group discussions are incorporated to deepen understanding, addressing questions like how to show odd numbers in pictograms and the practicality of 1-1 correspondence when dealing with larger quantities. This structured approach to learning about pictograms ensures students develop both the skills to create their own and the ability to interpret existing ones.

