Statistics - Draw pictograms 2, 5 & 10 - Planning
Maths Resource Description
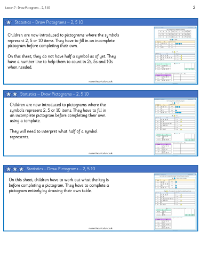
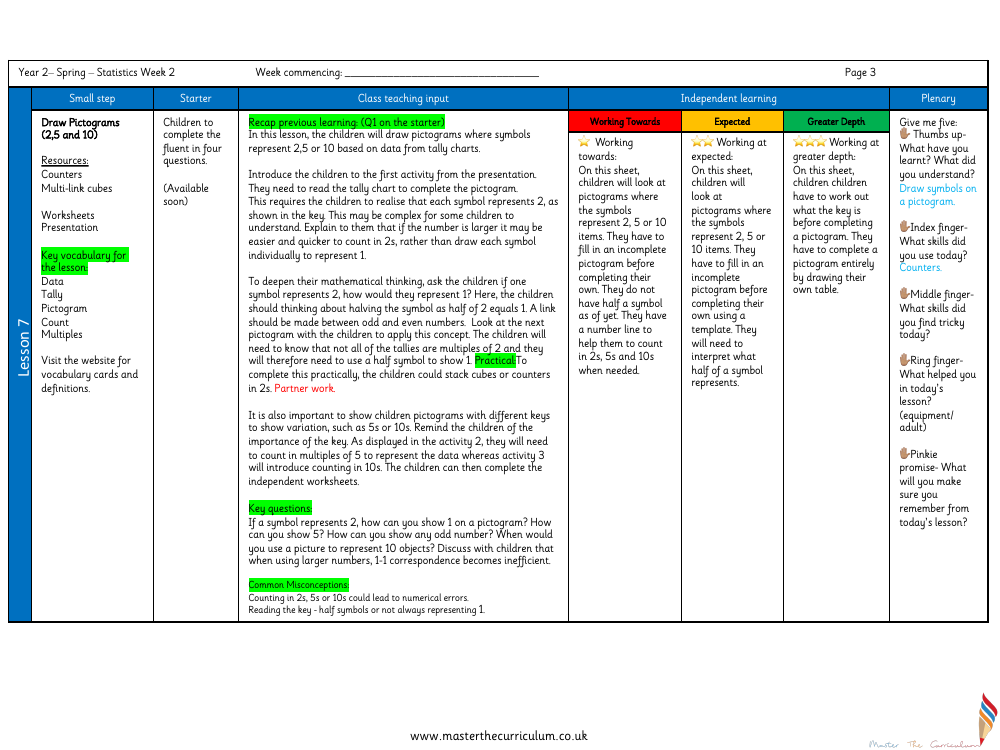
In the Year 2 statistics curriculum, students embark on a week dedicated to mastering the art of drawing pictograms, with a particular emphasis on symbols that represent values of 2, 5, and 10. The lesson utilises a variety of resources, including counters, multi-link cubes, worksheets, and a presentation to facilitate learning. Key vocabulary such as 'data', 'tally', 'pictogram', 'count', and 'multiples' are introduced, with additional support provided through vocabulary cards and definitions. The lesson begins with a refresher of prior knowledge before moving on to the main activity where children learn to interpret tally charts and translate them into pictograms. They are taught to count in multiples and to understand the significance of the key in a pictogram, which dictates the value each symbol represents.
During the class, students engage in hands-on activities such as stacking cubes or counters to visualise counting in 2s, and they explore how to represent different quantities, including odd numbers, using pictograms. The lesson plan includes differentiated worksheets to cater to varying levels of comprehension, from those just starting to grasp the concept to those delving into greater depth by determining the key and completing a pictogram from scratch. Critical thinking is encouraged through key questions that challenge students to consider the efficiency of using symbols for larger numbers and the representation of odd values. The lesson concludes with a reflective 'Give me five' activity that prompts students to think about what they've learned, the skills they've used and found challenging, and the strategies that have aided their learning, ensuring they remember the key takeaways from the session.

