Statistics - Draw pictograms 2, 5 and 10 - Worksheet
Maths Resource Description
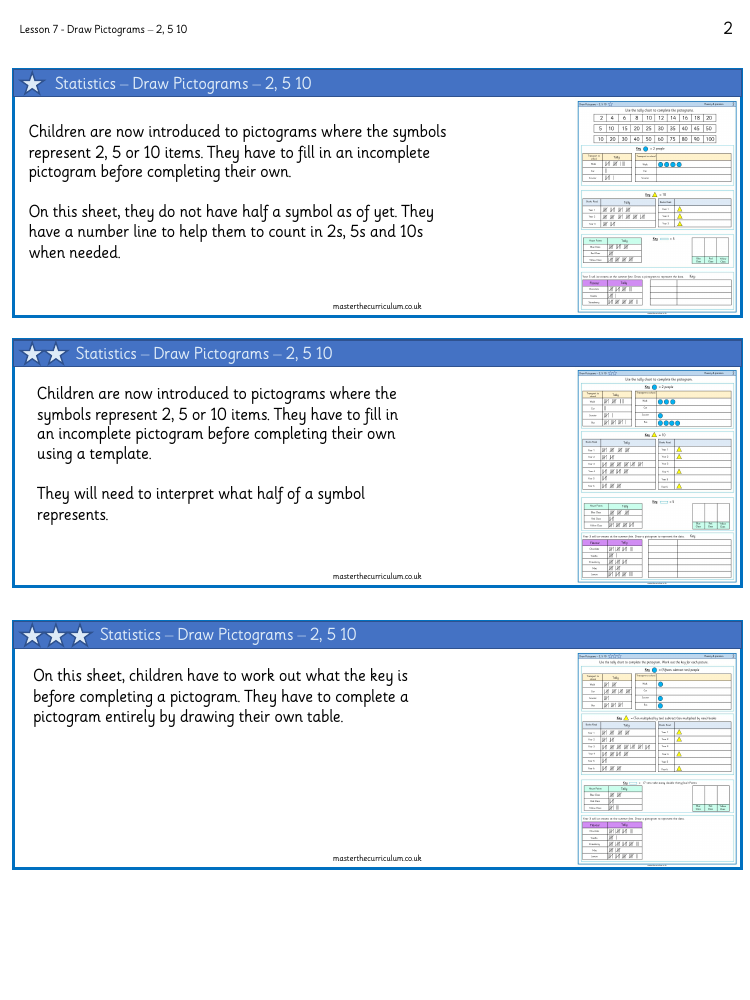
Mastering the art of representing data visually, children are introduced to the concept of pictograms, where symbols correspond to a specific quantity—2, 5, or 10 items. In this activity, they are tasked with completing an incomplete pictogram, as well as creating their own from scratch. Initially, the worksheet does not include half symbols, and a number line is provided to assist children in counting by twos, fives, and tens to accurately complete the pictogram. This exercise serves as a practical application of their understanding of quantity and symbol representation, without the complexity of fractional symbols.
Moving on to a more advanced stage, the children are challenged to decipher what a key represents before they can proceed with completing a pictogram. This task requires them to draw their own table and fully construct a pictogram, interpreting the data given in tally charts for various categories such as transport to school, books read by different year groups, and house points. Additionally, they are given a real-world scenario where they have to represent data from an ice-cream sale at a summer fete. The activity not only reinforces their numerical skills but also encourages precision and fluency in interpreting and representing statistical data through pictograms.

