Which countries are exploited and can we locate them on a world map? - Presentation
Geography Resource Description
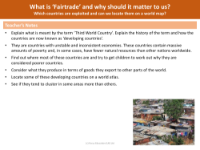
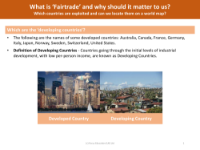
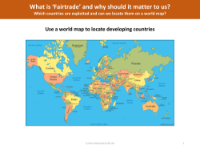
The term 'developing countries' refers to nations that are in the process of industrial development and typically have lower income per capita compared to developed nations. These countries often face challenges such as high infant mortality rates, poverty, and economic instability. Historically, the term 'third world country' was used during the Cold War era to describe countries that were not aligned with either the USA or the USSR, but it has since evolved to refer to countries with these developmental challenges. The term is now largely outdated and replaced by 'developing countries'. These nations can be found across different regions of the world including Central and South America, Africa, Asia, and various island states, collectively accounting for a significant portion of the world's population. Examples of developing countries include Argentina, Brazil, Bangladesh, Egypt, Nigeria, and Zimbabwe, with some countries like Burundi and the Central African Republic being classified as very poor.
'Fairtrade' is an important concept that seeks to ensure fair prices, decent working conditions, local sustainability, and fair terms of trade for farmers and workers in the developing world. It is relevant to us because it addresses the exploitation that can occur in international trade, particularly in developing countries. By supporting Fairtrade, consumers can contribute to the fight against poverty, climate change, and economic crisis, ensuring that producers in these countries are not marginalized. Locating these developing countries on a world map can help us understand the global patterns of development and trade. World maps highlighting these countries usually show darker regions to represent areas with a high concentration of developing nations, thereby providing a visual representation of the global distribution of economic disparity.