Maths
Year 5
statistics
Maths
Year 5
Statistics
Suggested search:
Graphs and charts
Tables
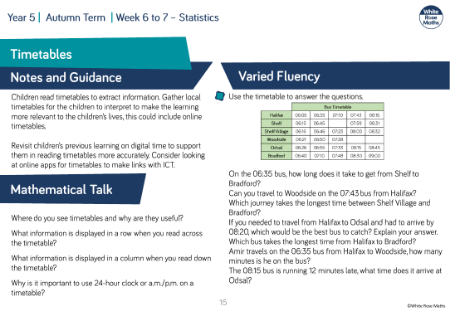
Timetables
Filtered by:
maths
year 5
statistics
Statistics
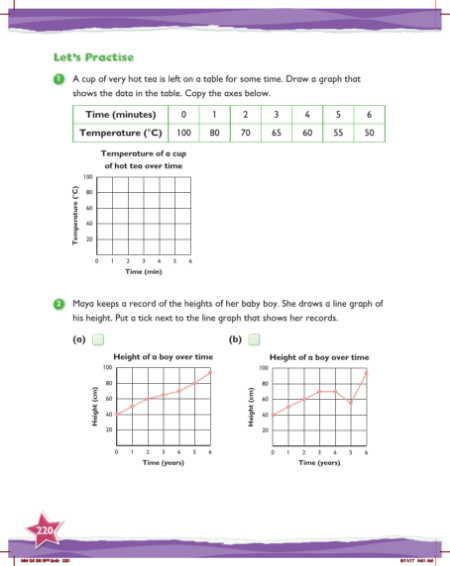
Max Maths, Year 5, Practice, Changing the scale on the vertical axis (1)
Worksheet
Maths
Y5
Statistics
Graphs and charts
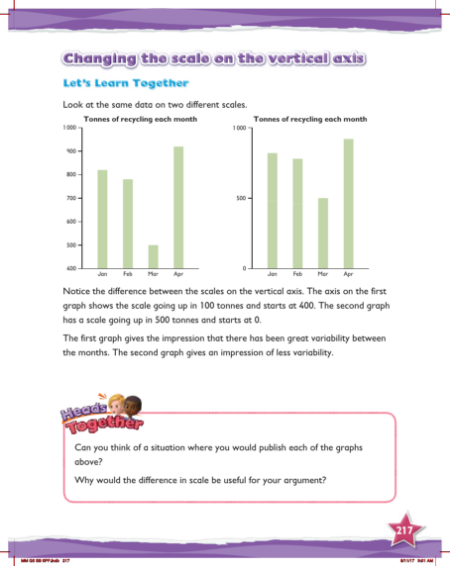
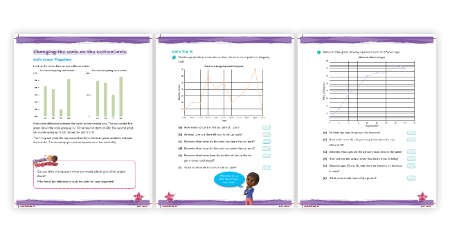
Max Maths, Year 5, Learn together, Changing the scale on the vertical axis
Resource
Maths
Y5
Statistics
Graphs and charts
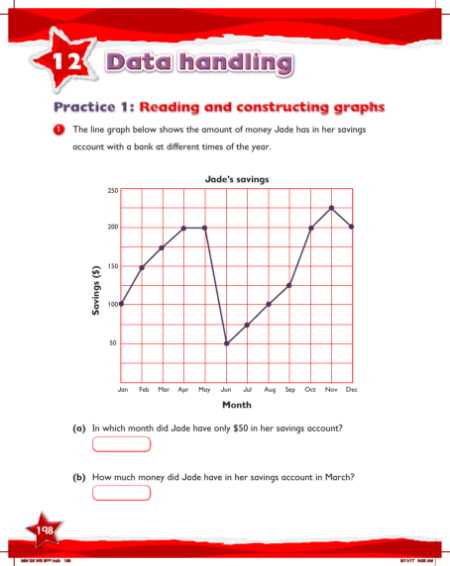
Max Maths, Year 5, Work Book, Changing the scale on the vertical axis
Worksheet
Maths
Y5
Statistics
Graphs and charts
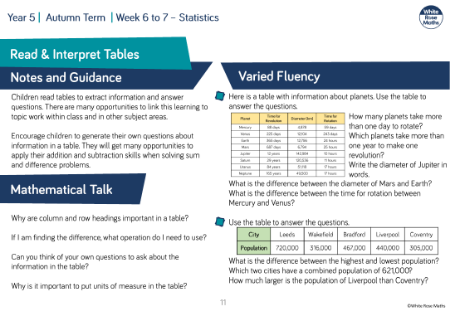
Review of drawing and interpreting frequency tables, pictograms and bar line charts
Lesson
Maths
Y5
Statistics
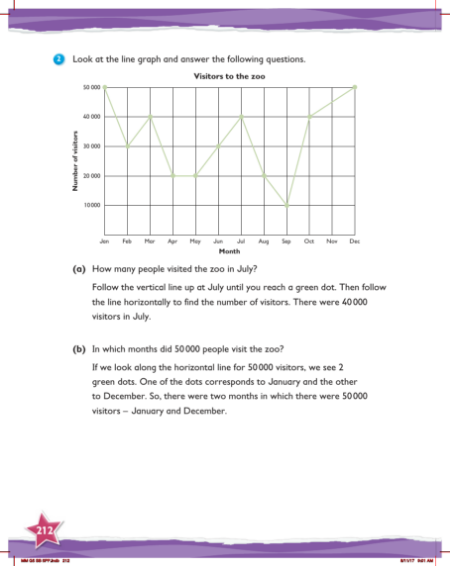
Max Maths, Year 5, Learn together, Reading and constructing graphs (3)
Resource
Maths
Y5
Statistics
Graphs and charts
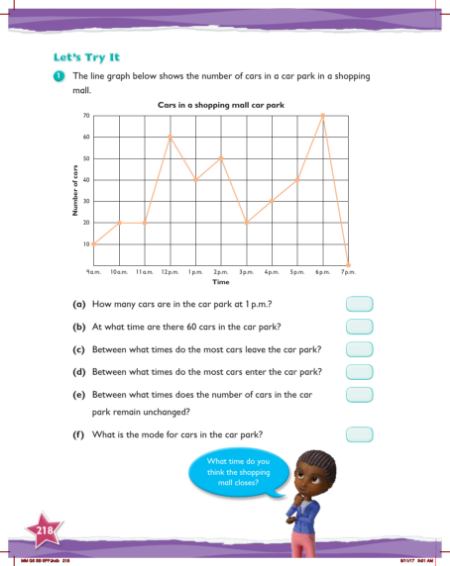
Max Maths, Year 5, Try it, Changing the scale on the vertical axis (1)
Worksheet
Maths
Y5
Statistics
Graphs and charts
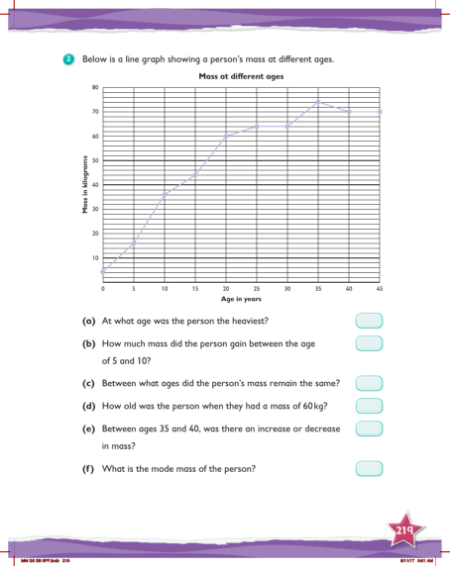
Max Maths, Year 5, Try it, Changing the scale on the vertical axis (2)
Worksheet
Maths
Y5
Statistics
Graphs and charts
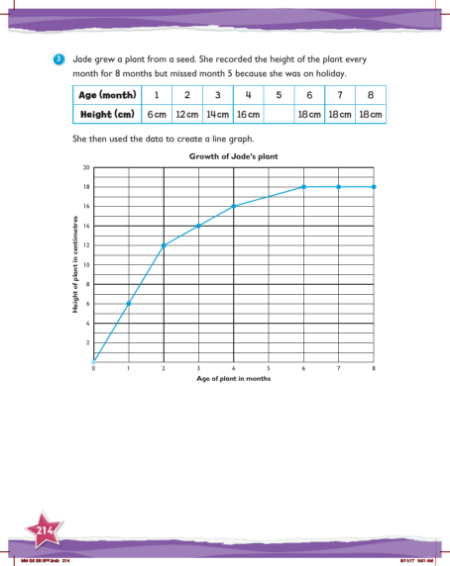
Max Maths, Year 5, Learn together, Reading and constructing graphs (5)
Resource
Maths
Y5
Statistics
Graphs and charts
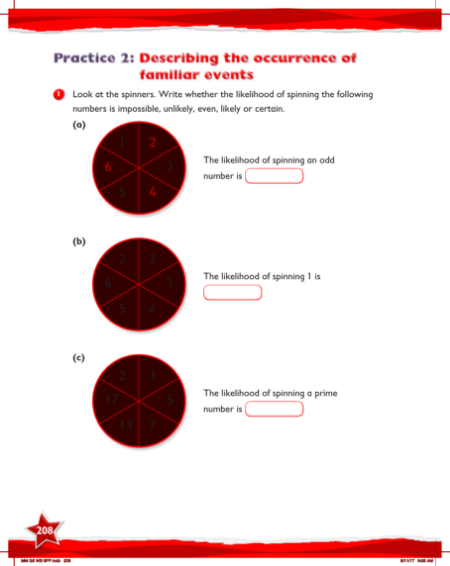
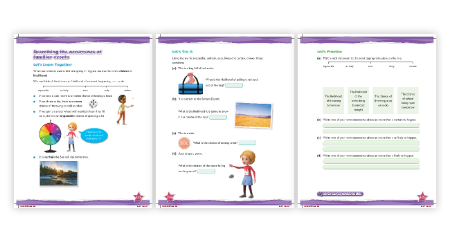
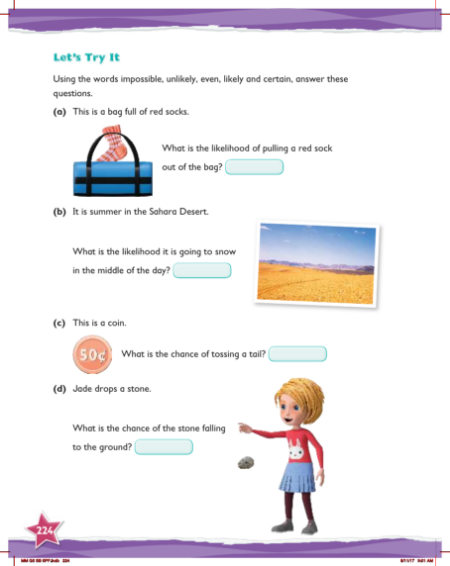
Max Maths, Year 5, Work Book, Describing the occurrence of familiar events
Worksheet
Maths
Y5
Statistics
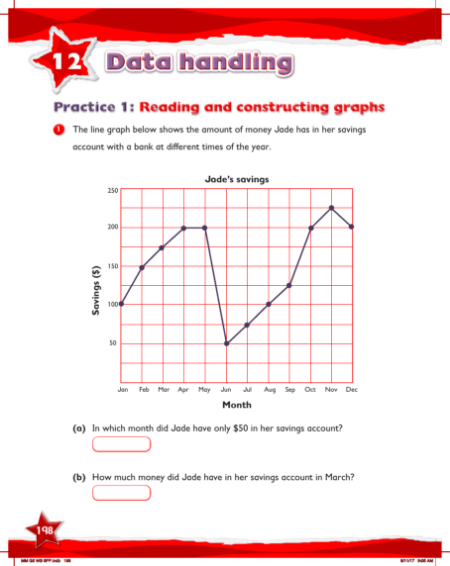
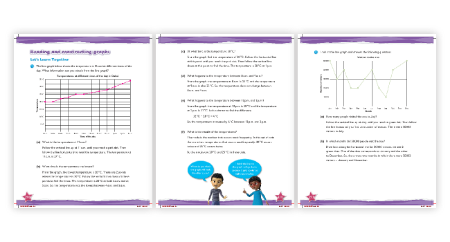
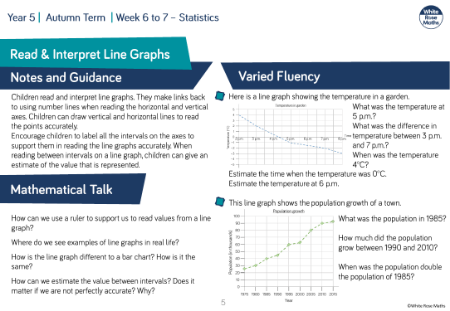
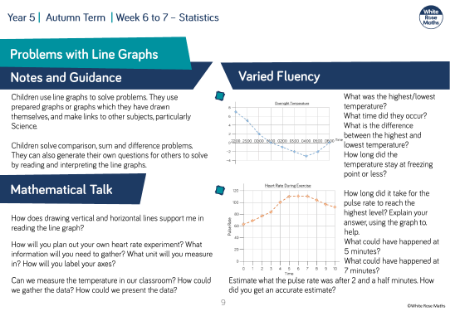
Max Maths, Year 5, Work Book, Reading and constructing graphs
Worksheet
Maths
Y5
Statistics
Graphs and charts
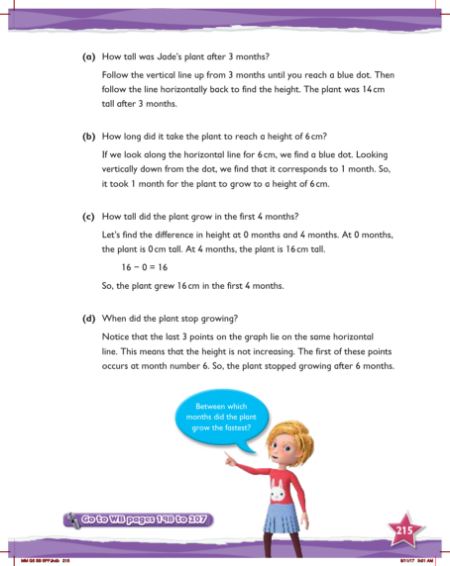
Max Maths, Year 5, Learn together, Reading and constructing graphs (6)
Resource
Maths
Y5
Statistics
Graphs and charts
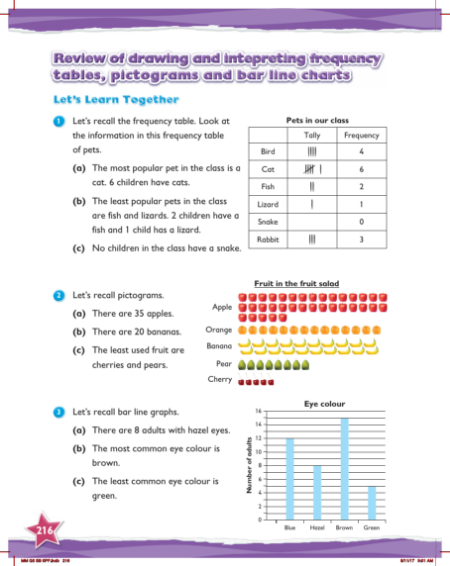
Max Maths, Year 5, Learn together, Review of drawing and interpreting frequency tables, pictograms and bar line charts
Resource
Maths
Y5
Statistics
Graphs and charts
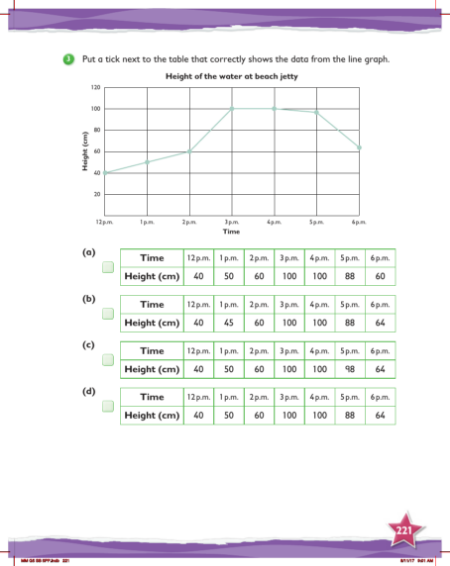
Max Maths, Year 5, Practice, Changing the scale on the vertical axis (2)
Worksheet
Maths
Y5
Statistics
Graphs and charts
This website uses cookies to enhance the user experience.
To get more information about these cookies check our
Hey! It looks like you're in the United States.


