Stems - Results Tables
Science Resource Description
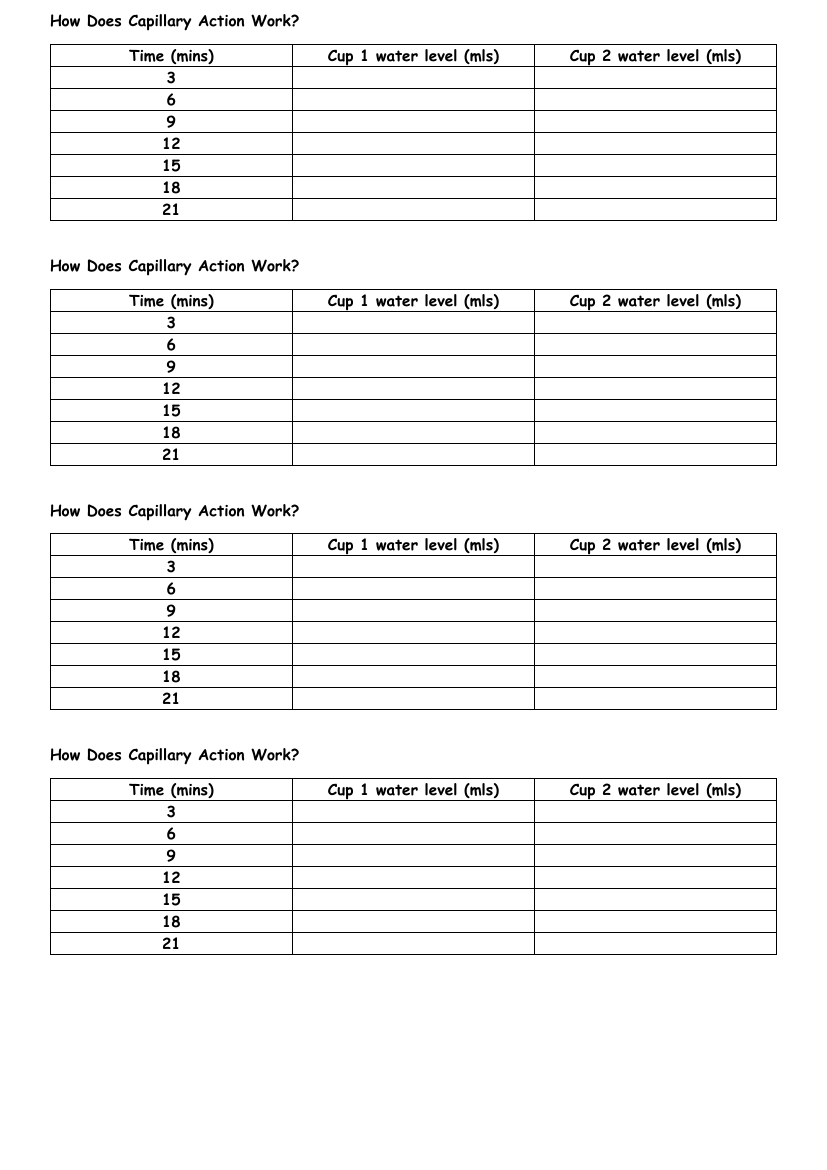
Investigating the phenomenon of capillary action requires a structured approach, and this is where results tables come into play. The tables are designed to record the changes in water levels over time in two separate cups, providing a clear and systematic way to observe how capillary action affects the water levels. Each table is laid out with two columns to note down the water levels in millilitres (mls) for Cup 1 and Cup 2, respectively. The rows correspond to specific time intervals, measured in minutes, at which the water level measurements are to be taken and recorded. The intervals are set at three-minute increments, starting from 3 minutes and extending up to 21 minutes.
The repeated structure of these tables indicates a series of experiments or multiple trials to ensure the accuracy and consistency of the results. By meticulously noting down the water levels at these regular intervals, one can analyse the rate and extent of capillary action over time. The empty cells under each time interval are placeholders for the data to be collected during the experiment. Once the experiment is conducted, and the data is filled in, these tables will serve as a valuable resource for understanding the dynamics of capillary action and drawing conclusions from the observed results.