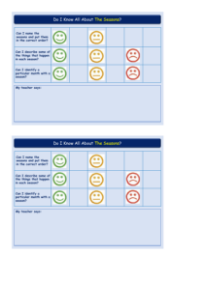
The Seasons - Results Tables
Science Resource Description
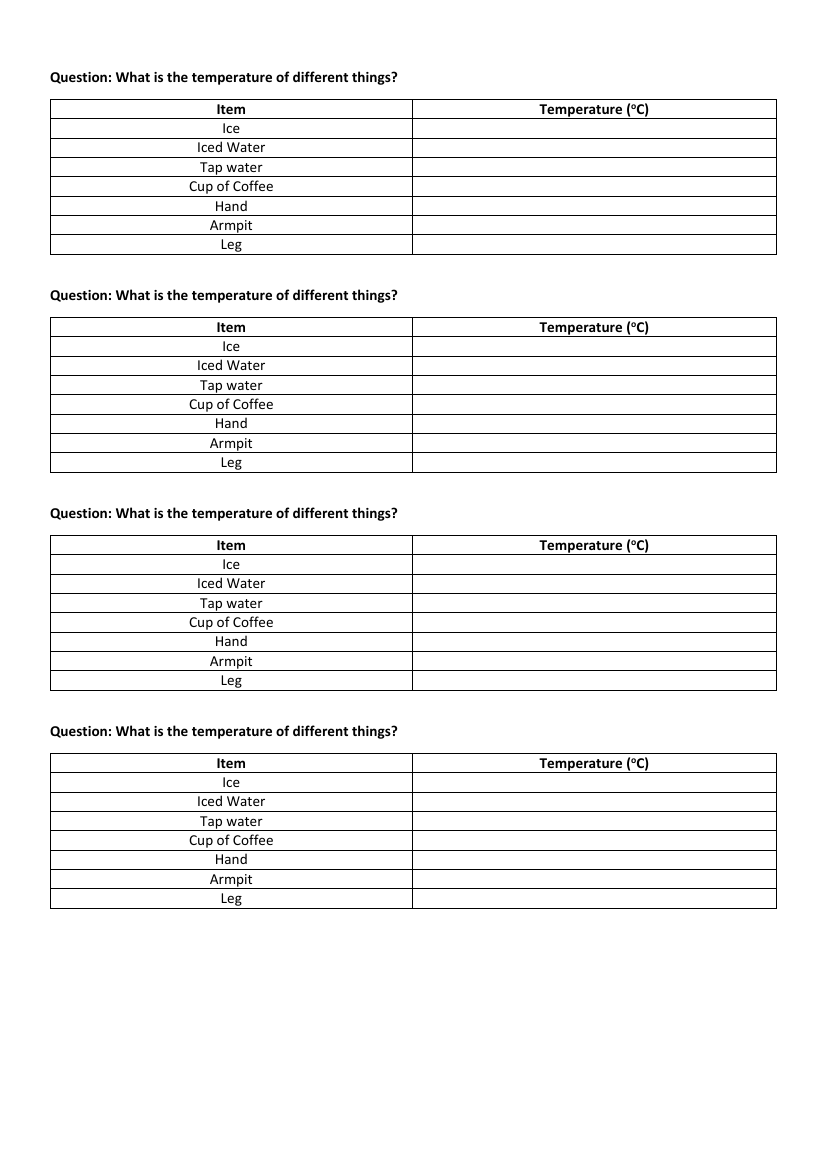
The provided text outlines a series of results tables designed to capture the temperature of various items and environmental conditions. The first set of tables poses the question, "What is the temperature of different things?" and lists items such as ice, iced water, tap water, a cup of coffee, a hand, an armpit, and a leg, with a column for recording their respective temperatures in degrees Celsius (°C). These tables are meant to provide a comparative analysis of the temperature of different substances and body parts, which could be an educational tool for understanding heat transfer and body temperature regulation.
Additionally, the text includes tables for recording meteorological data, such as rainfall and outside temperature, at a school throughout the year. The rainfall table is organized by month, from September to July, with a column to note the rainfall in centimetres (cm). This would be useful for tracking seasonal changes in precipitation. The temperature tables are structured to document the temperature outside the school on various dates, along with the corresponding weather conditions. This data could be beneficial for studying climate patterns, seasonal temperature fluctuations, and the impact of weather on the school environment.

