Max Maths, Year 2, Learn together, Making pictograms (5)

Maths Resource Description
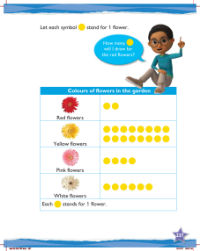
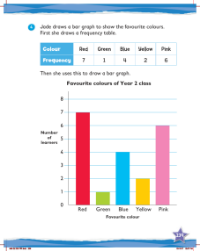
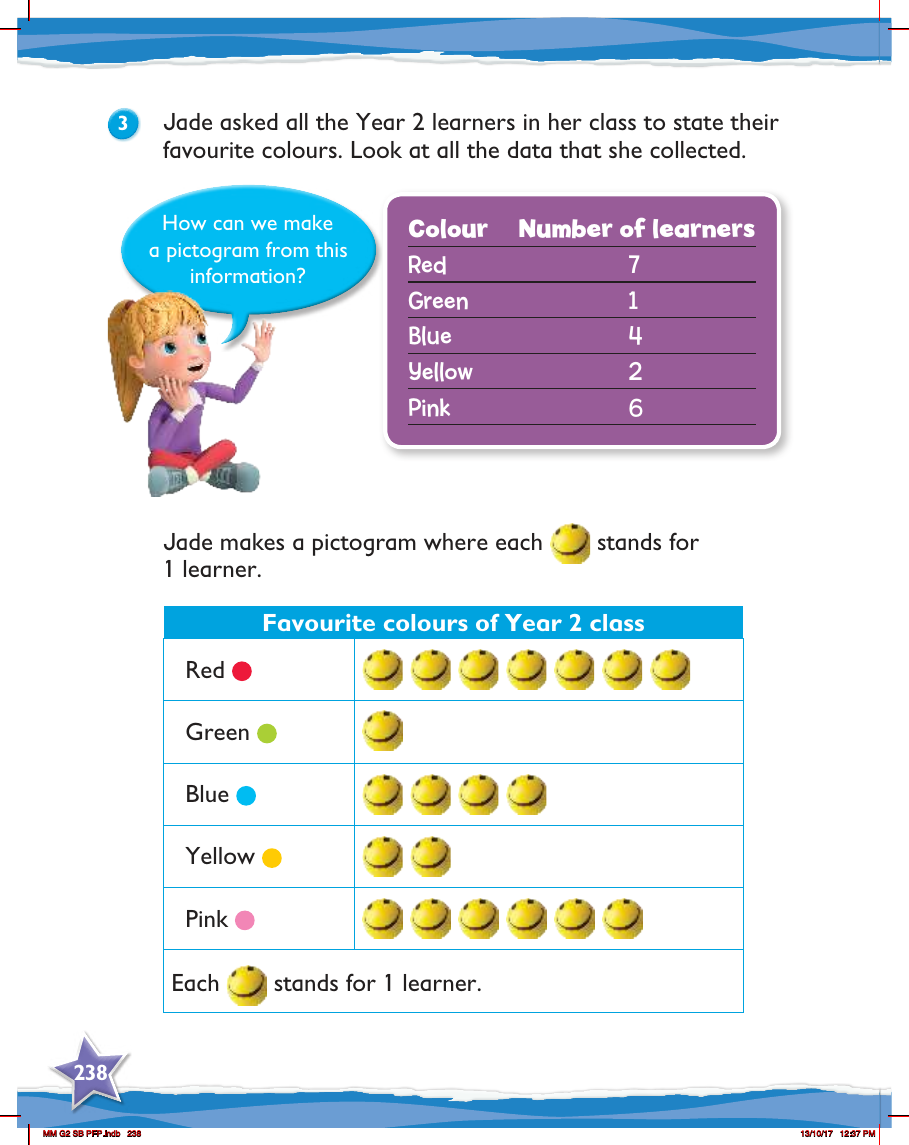
In a practical exercise designed for Year 2 pupils, Jade, a student, took the initiative to find out the favourite colours of her classmates. She conducted a survey and meticulously gathered the preferences of each learner in her class. The data collected represents a variety of colours chosen as favourites by the children, including red, green, blue, yellow, and pink. With this information at hand, Jade decided to create a pictogram to visually represent the results of her survey, making it easier for everyone to understand the collective colour preferences of the class.
The pictogram Jade designed is simple and child-friendly, where each symbol (in this case, a symbol that could be a shape or an icon) represents one learner's response. For the colour red, there are seven symbols indicating that seven learners chose red as their favourite colour. Green was favoured by one learner, blue by four, yellow by two, and pink by six. To construct the pictogram, Jade carefully placed the corresponding number of symbols next to each colour category. This visual representation not only makes the data easy to read for Year 2 pupils but also introduces them to the basics of data handling and chart interpretation.