Max Maths, Year 2, Try it, Making pictograms (1)
Maths Resource Description
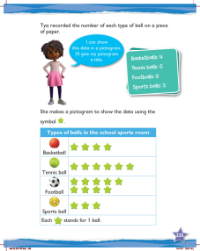
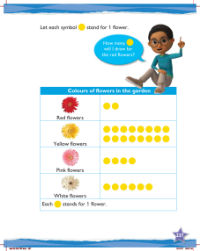
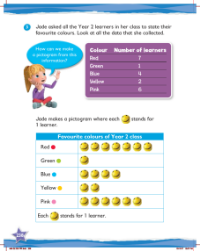
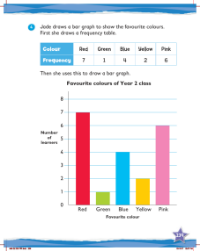
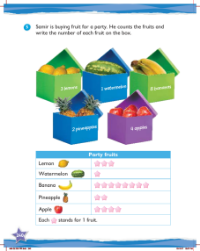
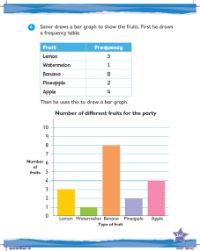
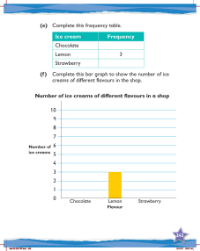
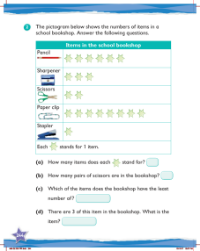
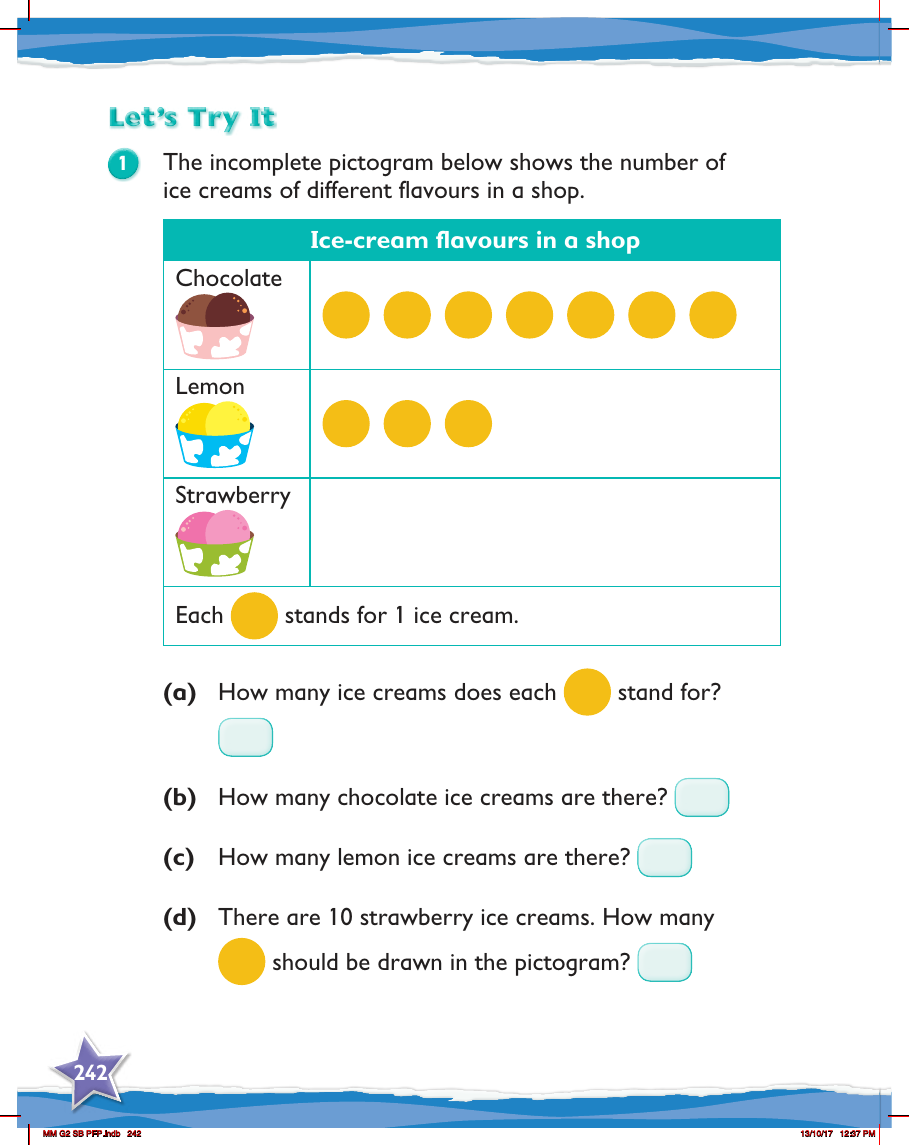
In a Year 2 mathematics exercise from Max Maths, students are introduced to the concept of pictograms as a visual representation of data. The task involves an incomplete pictogram that displays the number of various ice cream flavours available in a shop. The pictogram uses symbols to represent chocolate, lemon, and strawberry ice creams, with each symbol equating to one ice cream. Students are encouraged to engage with the pictogram by answering questions that test their understanding of the data presented.
The activity prompts children to determine the value of each symbol within the pictogram, specifically asking how many ice creams one symbol represents. They are then tasked with counting the symbols to find out the quantity of chocolate and lemon ice creams. For strawberry ice cream, the exercise provides the total number and asks the students to calculate the correct number of symbols to represent this quantity in the pictogram. This exercise is designed to help children practice basic data interpretation and representation skills in a fun and relatable context.
