Vocabulary - Statistics

Maths Resource Description
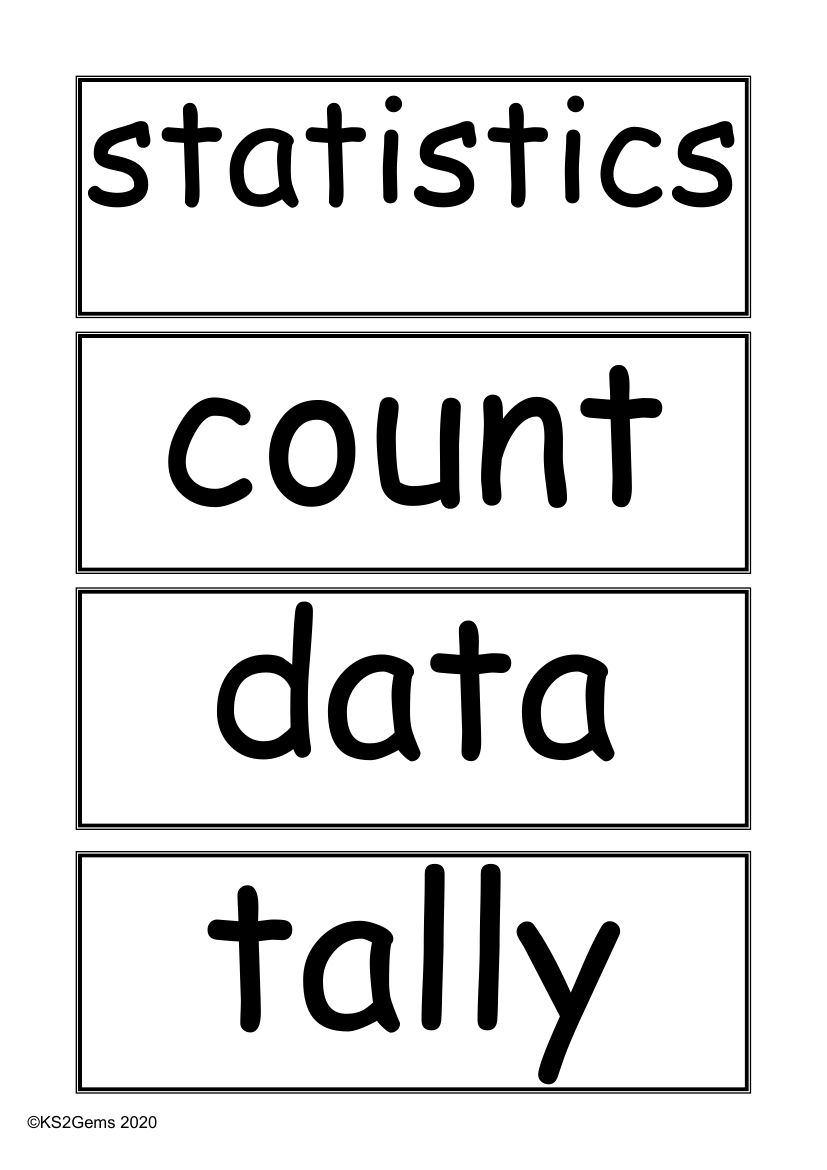
Statistics is a branch of mathematics that deals with the collection, analysis, and interpretation of data. The key vocabulary associated with statistics includes 'count', which refers to the total number of items in a set, and 'data', which represents the collected information that is subject to analysis. A 'tally' is a method of keeping count, often using marks or lines to represent numbers. Organising data can involve 'sorting' it into categories, and visually representing it using various types of 'graphs', such as 'block graphs' or 'pictograms', both of which are simplified ways to depict data visually.
To further represent data, one might 'group' similar items into 'sets' or create a 'list' to show ordered information. 'Charts' such as 'bar charts' display data using bars of different lengths, while a 'table' organises data in rows and columns for clarity. The 'frequency' of an item occurring is often shown in a 'frequency table', and relationships between different sets of data can be illustrated using 'Carroll diagrams' or 'Venn diagrams'. When creating these visual aids, it's important to include 'labels', 'titles', and accurately marked 'axes' to provide context and scale. Other concepts include understanding 'most popular' or 'least common' items within a dataset, conducting 'surveys', and recording results in a 'tally chart'. A 'database' can store large amounts of data, and a 'line graph' or 'bar line chart' can depict changes over time or compare different datasets. The 'range' of a dataset, including the 'maximum value' and 'minimum value', helps to understand the spread of results, while 'classify' involves categorising data based on specific criteria. Finally, the ability to 'interpret' and 'present' data is crucial in statistics, as is understanding the 'scale' and asking questions such as "How many more?" or "How many less?" to compare quantities. 'Time graphs' can illustrate changes over time, whereas 'discrete data' and 'continuous data' refer to countable and uncountable sets, respectively. Lastly, a 'timetable' is a structured schedule of events plotted against time intervals.


