Statistics - Read and Interpret Line Graphs - Worksheet
Maths Resource Description
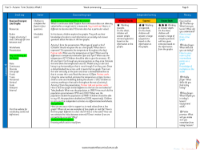
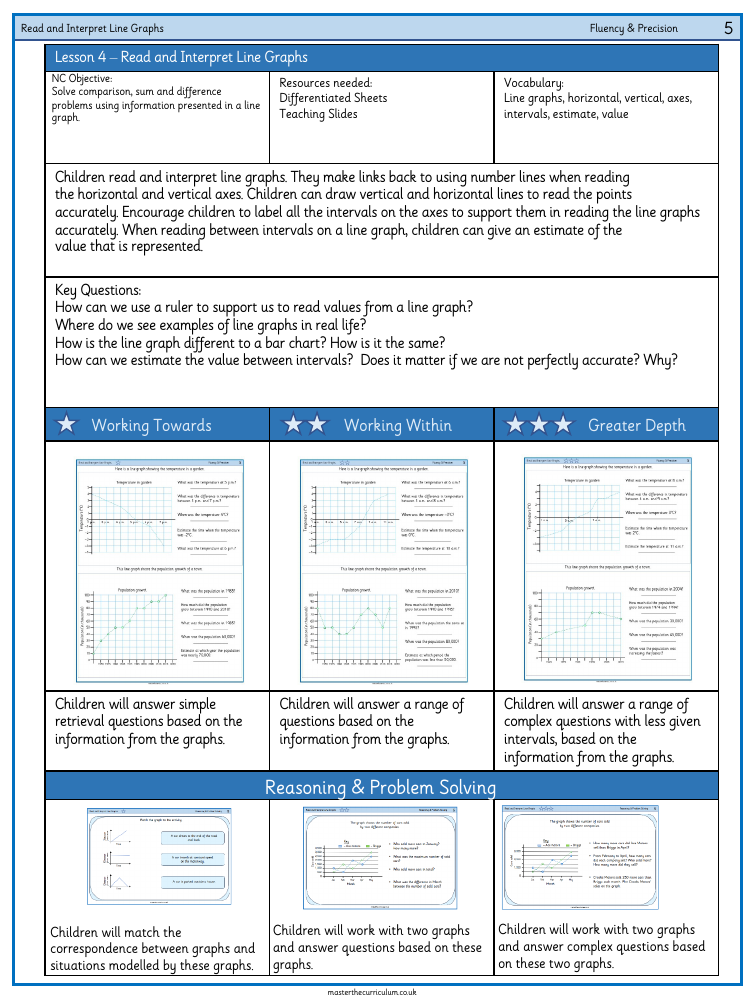
The 'Read and Interpret Line Graphs' worksheet is a comprehensive resource designed to help Year 6 students develop their skills in analysing and understanding line graphs. The National Curriculum objective for this lesson is to solve comparison, sum, and difference problems using information presented in line graphs. To facilitate learning, differentiated sheets and teaching slides are employed, catering to various levels of student ability. Key vocabulary such as 'line graphs', 'axes', 'intervals', 'estimate', and 'value' is introduced, ensuring students are familiar with the terminology used in the lesson.
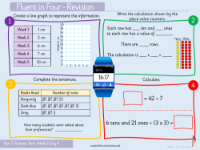
Different tasks require students to read and interpret data from line graphs, with a particular emphasis on using rulers to read values accurately and understanding the significance of labelling intervals on the axes. Questions are framed to encourage critical thinking about the use of line graphs in real life, the differences and similarities between line graphs and bar charts, and the importance of estimation. The worksheet provides a range of questions, from simple retrieval to more complex ones that require fewer given intervals, and even includes matching graphs to real-world situations. This helps students work towards fluency, work within the expected range, and achieve greater depth in their understanding of line graphs.

