Statistics - Read and Interpret Line Graphs - Starter
Maths Resource Description
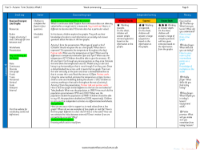
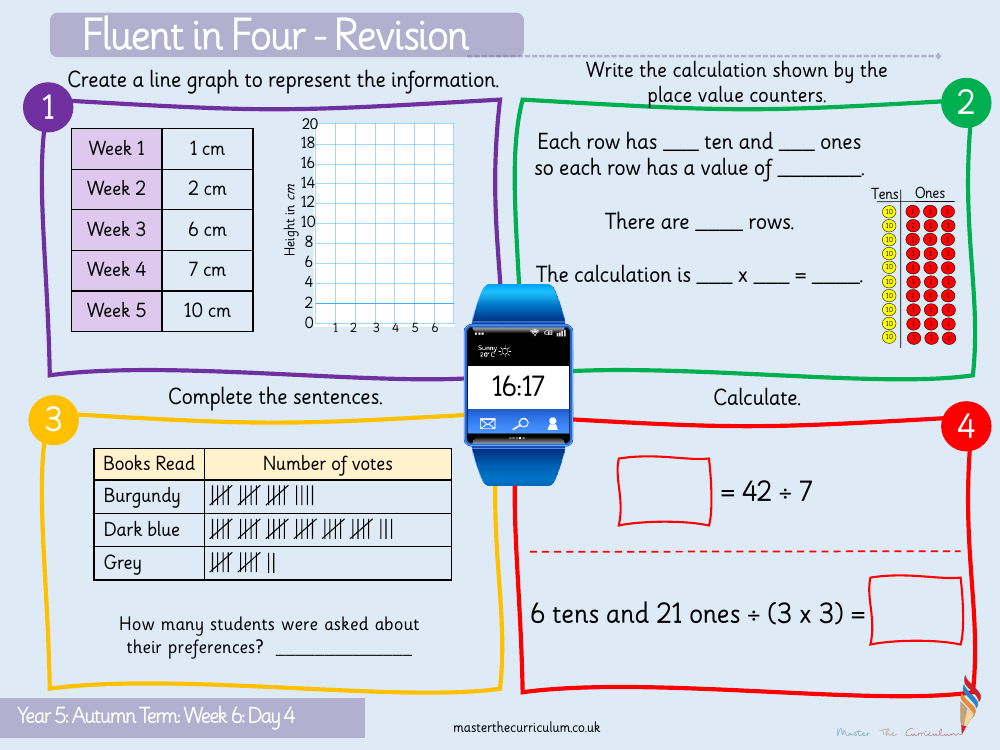
The 'Fluent in Four - Revision' section presents a mathematical challenge designed for Year 5 students in their Autumn Term, specifically for Week 6, Day 4. The task requires students to engage in various calculations and interpret place value counters to form mathematical expressions. For instance, one problem displays a series of place value counters representing tens and ones, and students must calculate the total value represented by these counters. This exercise not only reinforces their understanding of place value but also introduces division and multiplication within context. Additionally, students are asked to create a line graph based on given data, which includes measurements in centimetres over a five-week period. This task helps them to develop their skills in representing and interpreting data visually.
In the given example, students are instructed to fill in the blanks to complete sentences that describe the calculation process. They must determine the value of each row of counters, count the number of rows, and then perform a multiplication to find the total. Furthermore, the students are tasked with creating a line graph that depicts the number of votes for books read, with the graph's height in centimetres corresponding to the number of votes each book received over a period of time. This activity not only tests their ability to read and interpret data but also to present it effectively. The final section of the task requires students to deduce the number of students surveyed about their book preferences from the graph, enhancing their analytical skills.

