Statistics - Read and Interpret Line Graphs - Planning
Maths Resource Description
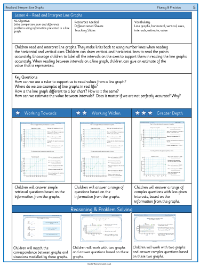
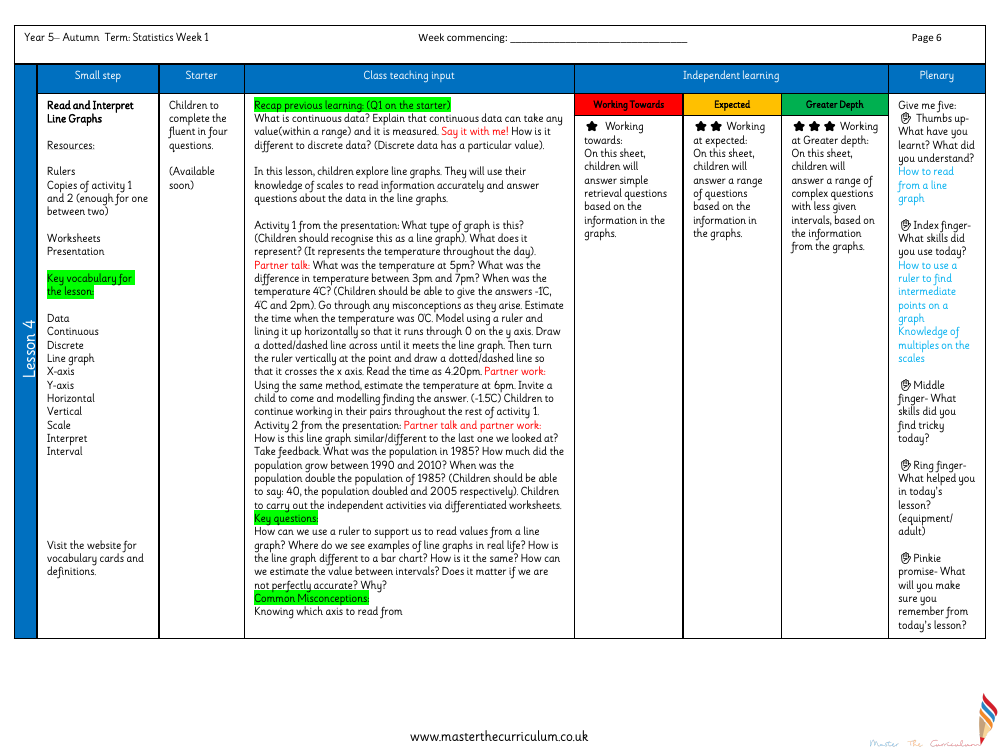
In a Year 5 lesson focused on Statistics, students delve into reading and interpreting line graphs. The lesson aims to equip students with the ability to accurately read scales and extract data from line graphs. The session begins with a recap of previous learning, where children distinguish between continuous and discrete data, understanding that continuous data can take any value within a range. The lesson progresses with an activity where students identify and discuss the characteristics of a line graph, such as the representation of temperature changes throughout the day. Using rulers and activity sheets, students practice pinpointing exact values on the graph, such as the temperature at a specific time, and estimating values, like when the temperature was 0°C. Misconceptions are addressed as they arise, ensuring a clear understanding of the concepts.
The lesson continues with a second activity where students compare different line graphs and extract information, such as population growth over a period of time. Differentiated worksheets challenge students at varying levels of understanding, from simple retrieval questions to more complex analysis with less given intervals. The plenary session reinforces the day's learning with a 'Give me five' reflection exercise, prompting students to consider what they have learned about reading line graphs, the skills they used, and the challenges they encountered. The lesson concludes with a commitment from the students to remember the key points of the lesson, ensuring that they can confidently use a ruler to find intermediate points on a graph and understand the practical applications of line graphs in real life.

