Statistics - Comparison, Sum and Difference - Worksheet
Maths Resource Description
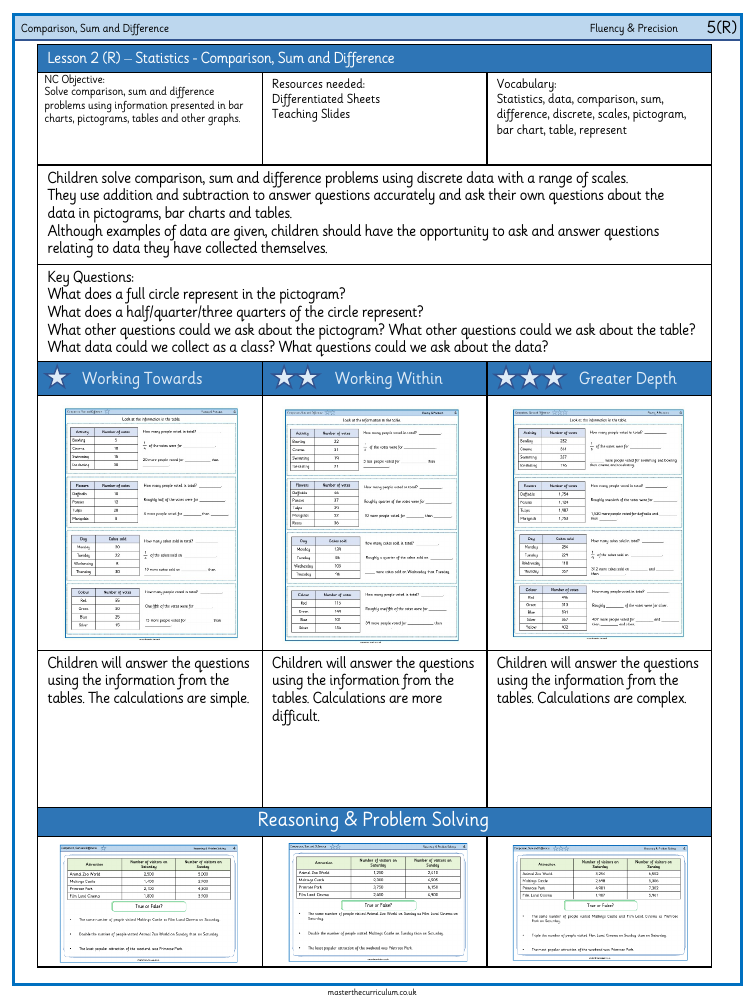
The "Statistics - Comparison, Sum and Difference" worksheet is a comprehensive resource designed to help Year 6 pupils develop their proficiency in solving problems related to comparison, sum, and difference using various forms of data representation. This includes interpreting information from bar charts, pictograms, tables, and other graphs. To facilitate learning, differentiated sheets and teaching slides are provided as resources. The key vocabulary for this lesson encompasses terms such as statistics, data, comparison, sum, difference, discrete, scales, pictogram, bar chart, table, and represent.
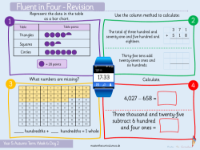
During the lesson, children tackle problems using discrete data across different scales and apply addition and subtraction to answer questions with precision. They are encouraged to engage with the data actively by asking and answering their own questions based on the provided pictograms, bar charts, and tables, or even data they have gathered themselves. The worksheet includes a series of tasks where children must calculate total numbers, identify proportions, and determine differences using the given data sets. The exercises are designed to cater to varying levels of difficulty, from simple calculations to more complex ones, ensuring that all students can work at an appropriate challenge level for their ability.

