Statistics - Comparison, Sum and Difference - Presentation
Maths Resource Description
The lesson on 'Comparison, Sum & Difference' in the context of statistics provides students with the opportunity to revisit their understanding of data representation through pictograms, bar charts, and tables. The lesson begins with a discussion on the terms 'comparison', 'sum', and 'difference', encouraging students to think about when they have previously encountered these concepts. The class then delves into activities that ask them to interpret data and perform calculations to compare points between teams, calculate total points, and determine the additional points needed for one team to match another. For example, they are tasked with finding out how many more points the Sycamore team has over the Ash team, the combined points of the Beech and Oak teams, and the points needed for the Ash team to equal the Oak team.
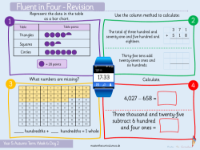
As the lesson progresses, students engage in various activities that require them to apply their knowledge of comparison, sum, and difference to real-life scenarios, such as determining the number of points different shapes have in a table and the number of votes for activities like bowling, swimming, and ice-skating. They are encouraged to ask further questions about the data presented in tables and to decide on a set of data to collect as a class, such as favourite books or films. The data is then recorded in a table and represented through pictograms or bar charts, with reasons given for their choice of representation. Additionally, reasoning exercises challenge students to identify mistakes in data interpretation and to verify statements based on visitor numbers to various attractions, enhancing their critical thinking and analytical skills.

