Statistics - Comparison, Sum and Difference - Planning
Maths Resource Description
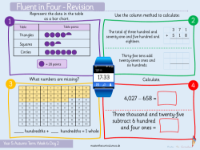
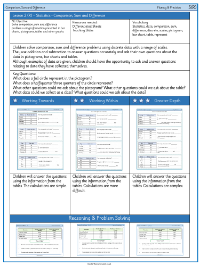
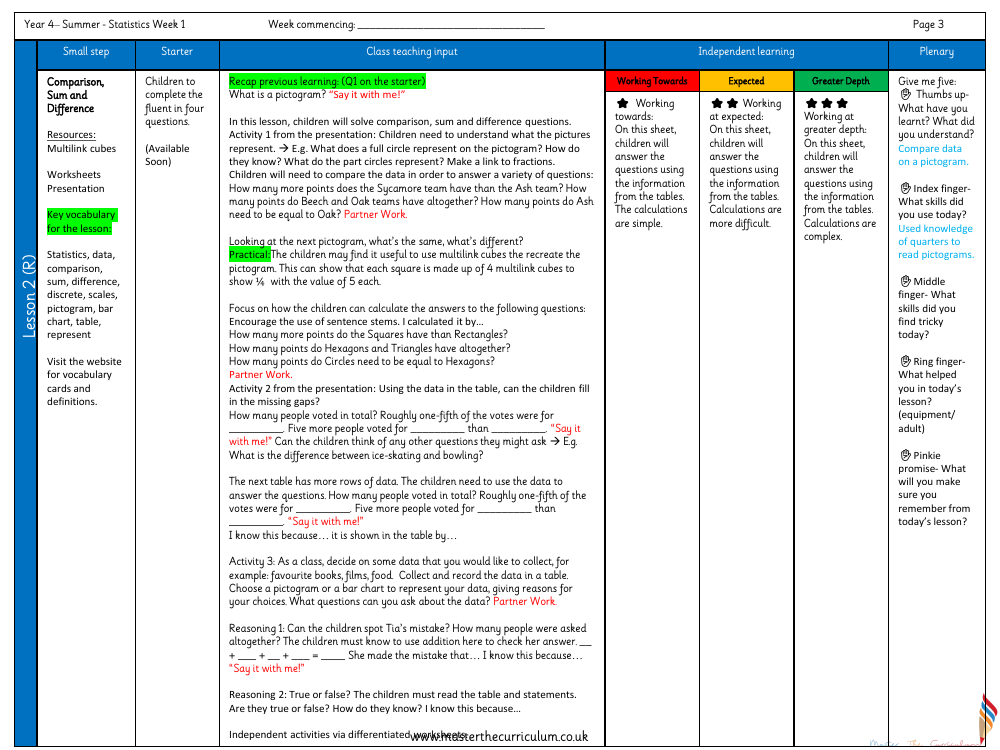
In a comprehensive lesson plan for Year 4 students, the focus is on understanding statistics through the comparison, sum, and difference of data. The lesson utilises multilink cubes and worksheets to engage students in hands-on learning. Key vocabulary such as 'statistics', 'data', 'comparison', 'sum', 'difference', 'discrete', 'scales', 'pictogram', 'bar chart', and 'table' is introduced, with resources available for further exploration of terms. The lesson begins with a starter activity that revisits what a pictogram is, ensuring students can confidently articulate their understanding. The main class input involves activities that teach students how to interpret pictograms, linking to fractions, and how to compare data to answer various questions. Practical application is encouraged by using multilink cubes to recreate pictograms, helping students visualise and understand data representation and value.
As the lesson progresses, students are tasked with independent learning activities that challenge them to fill in missing data in tables, ask questions about pictograms and tables, and perform calculations to compare values. The lesson also includes reasoning exercises where students must identify errors in data interpretation and verify the truthfulness of statements based on their understanding of the tables. Differentiated worksheets cater to varying levels of proficiency, from simple calculations for those working towards expected levels to more complex ones for students working at greater depth. The plenary session involves key questions to reinforce learning and address common misconceptions, such as misreading charts and tables or making miscalculations. This structured approach ensures that students develop a solid foundation in interpreting and analysing statistical data.

