Statistics - Interpret Pictograms 2, 5 & 10 - Worksheet
Maths Resource Description
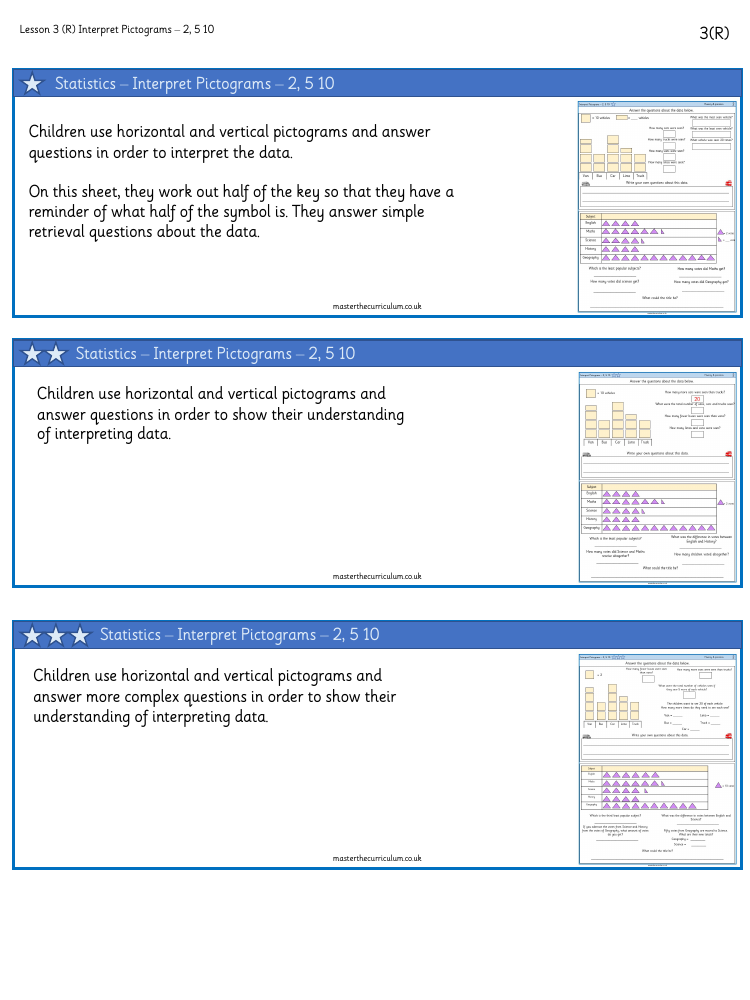
The worksheet provided is an educational resource aimed at helping children understand and interpret data using pictograms with keys representing 2, 5, and 10 units. The exercises require students to engage with both horizontal and vertical pictograms, answering various questions to demonstrate their grasp of the information presented. Initially, students work out half of the key to familiarise themselves with the value of half a symbol within the pictogram. They then proceed to answer straightforward retrieval questions about the depicted data, such as the number of cars, trucks, vans, and limos seen, or the popularity of different school subjects based on votes.
As the tasks progress, the questions become more complex, challenging the students to delve deeper into data interpretation. They might be asked to compare the popularity of subjects, calculate total votes, identify the most or least seen vehicles, or determine the difference in votes between subjects. To further test their understanding, students are encouraged to write their own questions about the data. The worksheet also includes a section for answers, providing a quick reference for students to check their work. This interactive approach to learning statistics not only teaches children how to interpret pictograms but also enhances their skills in fluency and precision when dealing with numerical data.

