Statistics - Interpret Pictograms 2, 5 & 10 - Presentation
Maths Resource Description
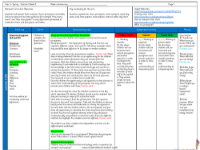
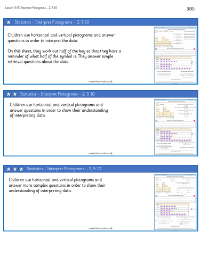
Students are encouraged to delve deeper into the world of statistics through the interpretation of pictograms, with a focus on values represented by 2, 5, and 10. The lesson aims to enhance their understanding of data representation by asking questions related to the information depicted in a pictogram. One of the key learning points is understanding the role of a key in a pictogram, which is essential for deciphering the data it represents. For instance, students are asked to consider how to represent the number zero in a pictogram and to engage with questions like comparing quantities, such as the number of sparrows to robins, or calculating the total number of birds based on the pictogram's key.
In subsequent activities, students apply their knowledge to various scenarios, such as determining the difference in the number of cars compared to buses and finding the total number of vehicles represented. They are also prompted to create their own questions to further their understanding and to discuss with peers. The lesson extends to interpreting pictograms that cover different topics, such as sports, where students must deduce the most popular sport based on the pictogram's data and suggest suitable titles for the pictograms. Additionally, they are tasked with evaluating true or false statements based on the data depicted, such as the popularity of animals on a farm or the total number of pigs and sheep. The lesson concludes with independent work where students answer and formulate questions about the data presented in the pictograms, fostering critical thinking and data analysis skills.

