Statistics - Interpret Pictograms 2, 5 & 10 - Planning
Maths Resource Description
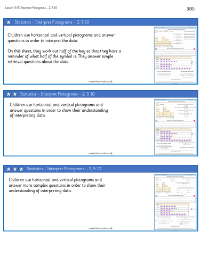
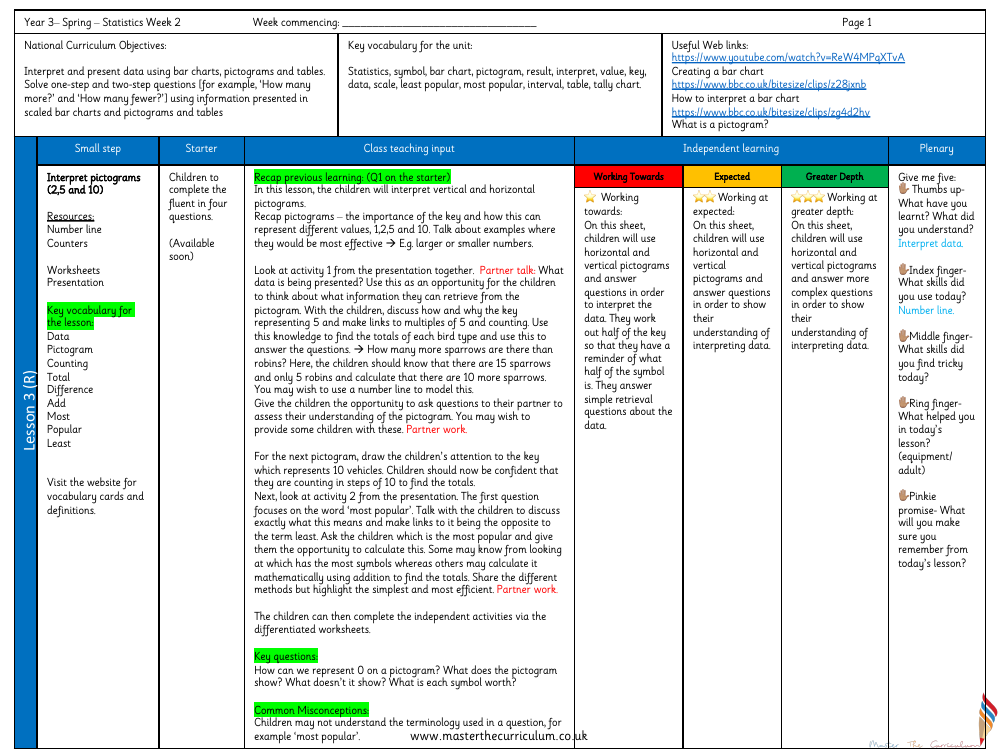
In a Year 3 mathematics lesson focused on statistics, students delve into the world of data representation and interpretation through the use of pictograms. The National Curriculum objectives for this lesson include interpreting and presenting data using bar charts, pictograms, and tables, as well as solving questions based on the information presented in these formats. Key vocabulary terms such as 'statistics', 'symbol', 'pictogram', 'interpret', and 'scale' are emphasised. The class begins with a review of previous knowledge on pictograms, discussing the significance of the key and its representation of different values. Students are then invited to interpret vertical and horizontal pictograms, using their understanding of the key to determine the total number of items represented and to solve comparative questions, such as determining how many more of one item exists compared to another.
Throughout the lesson, students engage in partner work and group discussions to enhance their comprehension of the data displayed in pictograms. They explore concepts like the most and least popular items by analysing pictograms with different scales, where the key might represent 5 or 10 units. Independent learning is facilitated through differentiated worksheets that cater to varying levels of understanding, from working towards the expected level to achieving greater depth in data interpretation. The lesson concludes with a reflective 'Give me five' activity, where students consider what they have learned, the skills they have used and found challenging, and the resources or support that aided their learning. They also make a 'pinkie promise' to remember key aspects of the lesson, ensuring a solid grasp of interpreting pictograms and the associated vocabulary.

