Statistics - Make tally charts - Worksheet
Maths Resource Description
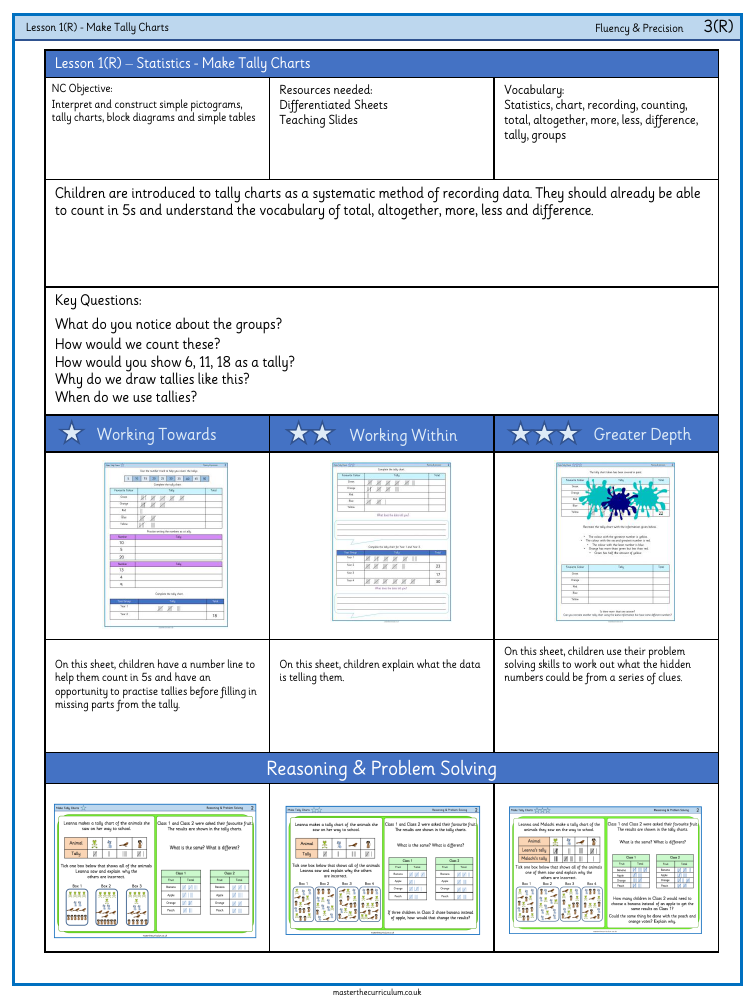
The worksheet from masterthecurriculum.co.uk is designed to teach children how to create and interpret tally charts, an essential skill within the realm of statistics. According to the National Curriculum objective, students are expected to learn how to interpret and construct simple pictograms, tally charts, block diagrams, and simple tables. To facilitate this learning, differentiated sheets and teaching slides are provided as resources. The lesson plan assumes that students are already comfortable with counting in fives and are familiar with terms such as 'total', 'altogether', 'more', 'less', and 'difference'. Through various activities, children will practice making tallies to represent numbers and complete tally charts with missing parts. They will also analyse data to understand what it reveals and solve problems to determine hidden numbers based on given clues.
The activities are structured to cater to different learning levels, from 'Working Towards' to 'Working Within', and up to 'Greater Depth'. For instance, children at the 'Greater Depth' level will be challenged with reasoning and problem-solving tasks, such as recreating a tally chart obscured by paint using given clues about the data. They will also compare tally charts to identify similarities and differences and apply logical thinking to deduce changes in data. The worksheets include a number of practical exercises, such as completing tally charts for favourite colours or year group preferences, and they prompt students to reflect on what the data tells them. These hands-on tasks aim to enhance students' fluency and precision in handling statistical information through the use of tally charts.

