Statistics - Make tally charts - Presentation
Maths Resource Description
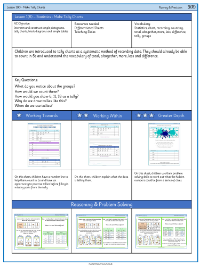
In a series of engaging activities about making tally charts, students are introduced to the practical application of statistics. The lesson begins by prompting pupils to think about situations where data might be collected and how it can be represented using tallies. They are encouraged to consider where they have seen tally charts before and what the term 'tally' means. The activities range from counting favourite colours to determining the most popular animals or foods. Students are asked to complete tally charts with the given data, such as the number of children preferring certain colours or animals, and then to interpret the information by telling the 'story' of the data, which helps them understand the significance and patterns within the collected information.
Further activities delve deeper into the concept of tally charts, asking students to reason why tallies are drawn in a particular way and to explore the use of tallies in different contexts like class equipment, sports, or types of sweets. Pupils are tasked with completing tally charts for various categories, including year groups, where they must find totals and compare results. The exercises aim to develop students' abilities to analyse and compare data, as well as to articulate their findings. The reasoning activities challenge students to identify errors in tally charts and to distinguish between similarities and differences in data sets, such as the favourite ice-cream flavours of two different classes. These activities not only reinforce the mechanics of tallying but also foster critical thinking and data interpretation skills.

