Statistics - Make tally charts - Planning
Maths Resource Description
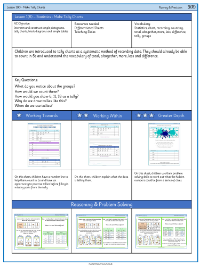
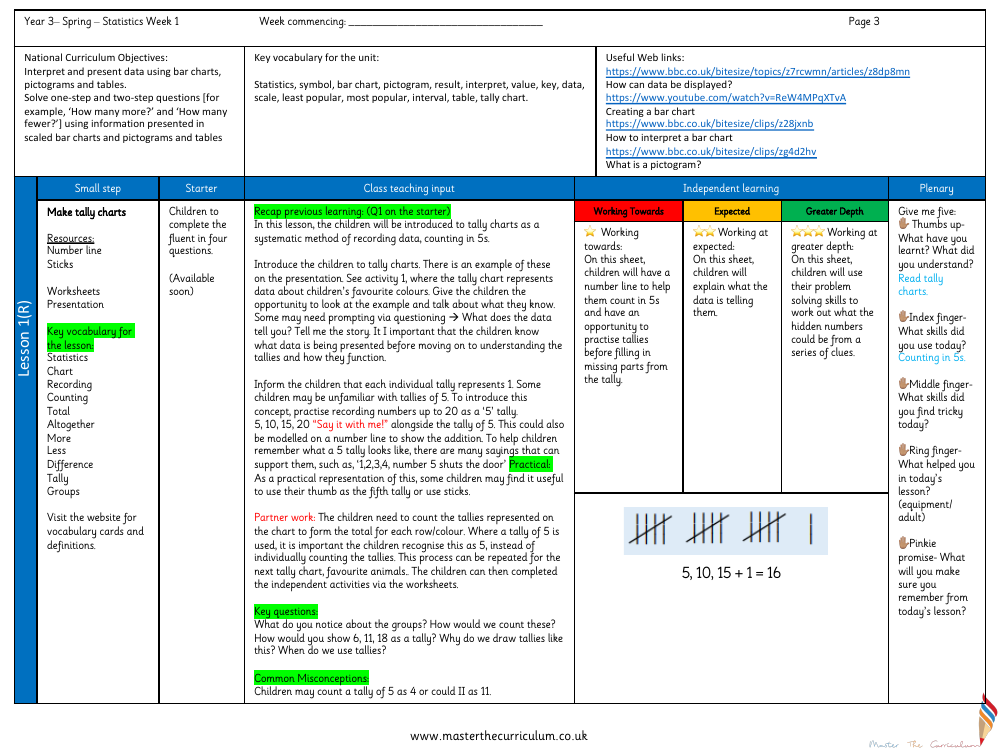
In a Year 3 statistics lesson, students are introduced to the concept of tally charts as part of their Spring term learning. The National Curriculum objectives for this lesson include interpreting and presenting data using various methods such as bar charts, pictograms, and tables. Additionally, students are taught to solve questions using information from these scaled representations. The key vocabulary for this unit encompasses terms like 'statistics', 'tally chart', and 'scale', among others. During the lesson, students use a number line and sticks as resources to help them understand how to make tally charts. They learn that each tally represents one unit, and groups of five are represented by a set of four tallies with a diagonal line across them, which helps in counting in fives.
The lesson plan engages students in activities that require them to count tallies and understand the data they represent, such as children's favourite colours or animals. Partner work is encouraged, with a focus on recognising groups of five tallies as a single unit of five rather than counting each tally individually. This helps to avoid common misconceptions, such as miscounting a group of five tallies as four. The lesson concludes with reflection activities where students articulate what they have learned, the skills they used, and what they found challenging. Differentiated worksheets are provided to cater to varying levels of understanding, from those working towards the expected level to those capable of greater depth, with tasks ranging from counting practice to problem-solving with hidden numbers.

