Statistics - Table - Presentation
Maths Resource Description
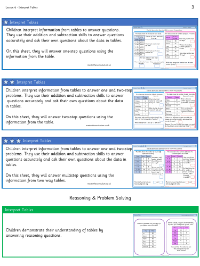
In a series of interactive lessons on statistics, students are introduced to the concept of tables as a means of presenting and interpreting data. The lessons focus on the practical application of tables, encouraging students to discuss and understand when and why data might be presented in this format. They are tasked with giving examples of when tables are useful and are then presented with a variety of tables to analyse. For instance, one table displays the sports played by different children, prompting questions such as how many children play tennis and which child is the most active in sports. Students are encouraged to extract information from the tables to answer these questions, thus reinforcing their understanding of how to read and interpret tabulated data.
Further activities delve into more complex data sets, such as a table showing the increase in bus ticket prices over time. Students are challenged to calculate the price increases and identify which ticket prices have changed the most or the least. These exercises not only enhance their statistical skills but also their mathematical reasoning. Additional exercises include creating questions based on the hours a shop is open on different days of the week and evaluating the accuracy of a table showing the number of boys and girls participating in after-school clubs. The lessons culminate with independent work where students use the data presented in the tables to formulate and answer questions, fostering critical thinking and real-world application of statistics.

