Statistics - Table - Planning
Maths Resource Description
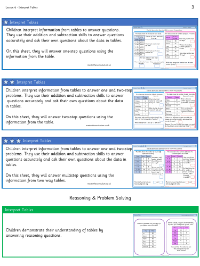
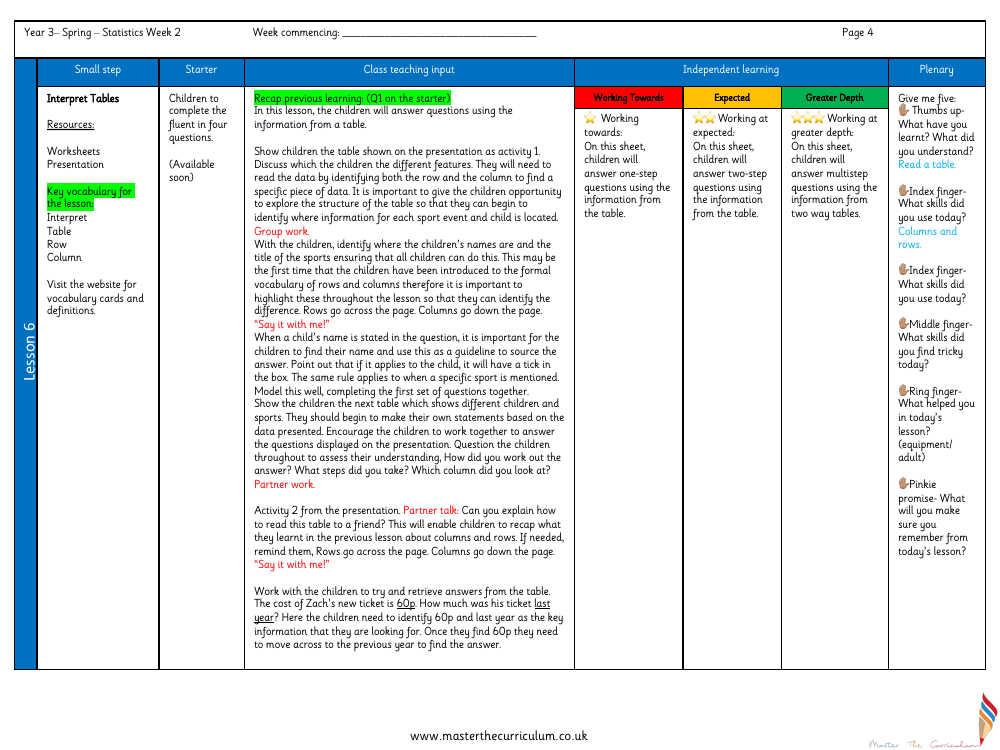
Year 3 students embark on a journey to master the skill of interpreting tables during their Spring term Statistics lessons. The focus of Week 2 is to enable children to confidently read and extract information from tables by identifying key components such as rows, which run across the page, and columns, which extend downwards. The lesson is supported by resources that include worksheets and a presentation, with additional vocabulary cards available on the website. The class begins with a recap of previous learning and a starter activity to get the students thinking. The class teaching input involves a guided exploration of a table's structure, where the children learn to locate data corresponding to specific sports events and children's names. This is followed by independent learning, where students are encouraged to make their own statements based on the presented data and answer questions in pairs, reinforcing their understanding of how to navigate the table's rows and columns.
As the lesson progresses, the students engage in a second activity that challenges them to explain the process of reading a table to a peer, reinforcing the lesson's key vocabulary. They are then tasked with using the table to answer questions that require them to find differences in prices, such as the cost of a ticket from the previous year. This exercise may involve mental calculations or the use of counters and money for those who need a more tactile approach. The plenary session involves a "Give me five" reflection activity, where students share what they've learned, the skills they've used, and the aspects they found challenging. The differentiated worksheets cater to varying levels of understanding, from working towards expected standards to achieving greater depth by answering multi-step questions. Throughout the lesson, key questions prompt students to consider the practical applications of tables in real life and to think of additional questions that could be answered using the table's data, while also addressing common misconceptions about row and column identification.

