Statistics - Draw pictograms 2, 5 & 10 - Worksheet
Maths Resource Description
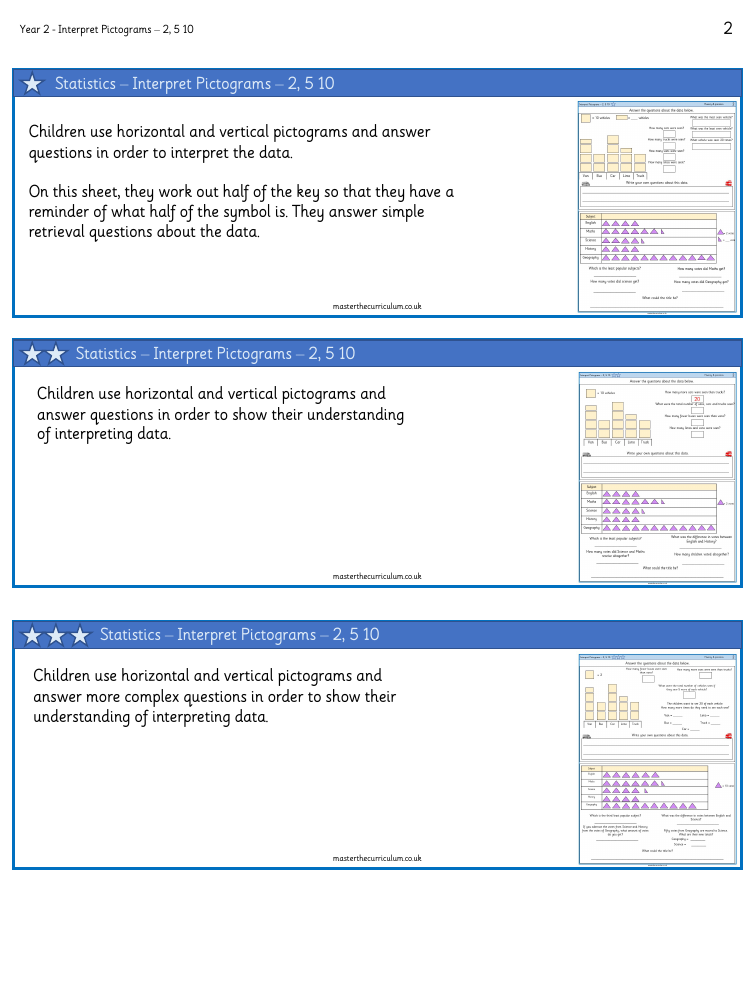
In a series of worksheets designed for Year 2 students, the focus is on interpreting pictograms with keys representing 2, 5, and 10 units. The worksheets encourage children to engage with both horizontal and vertical pictograms, requiring them to answer a variety of questions to demonstrate their comprehension of the data presented. Initially, students are tasked with identifying halves of the key symbols and responding to straightforward retrieval questions. They are prompted to calculate the number of vehicles or votes for different subjects, such as determining how many cars or trucks were seen, or the popularity of various school subjects.
As the complexity of the questions increases, students delve deeper into data interpretation. They are asked to compare quantities, such as the difference in votes between subjects or the number of cars seen compared to trucks. Additionally, they perform tasks that involve hypothetical scenarios, like reallocating votes or determining how many more times certain vehicles need to be seen to reach a target. The aim is to develop fluency and precision in interpreting data, as well as to encourage critical thinking by asking the students to formulate their own questions about the data. Answer keys are provided for some of the exercises, which include numerical answers and prompts for creating subject-related titles for the data sets.