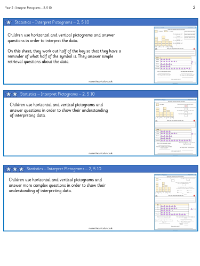
Statistics - Interpret pictograms 2, 5 & 10 - Planning
Maths Resource Description
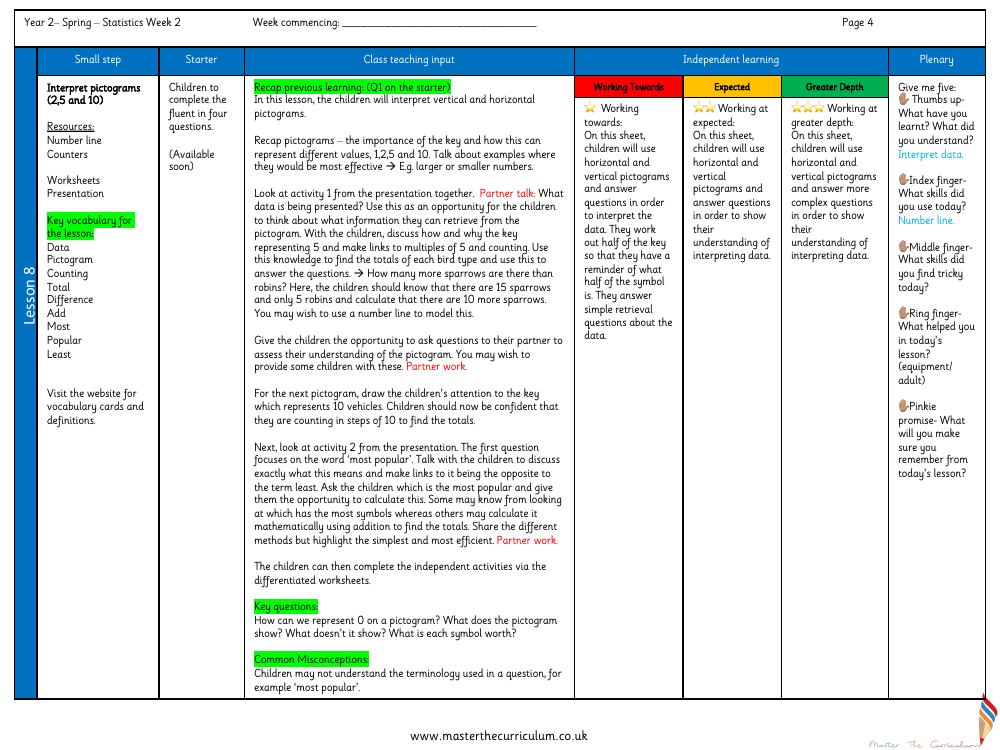
In a Year 2 statistics lesson, children delve into the world of data representation through the interpretation of pictograms, focusing on keys with values of 2, 5, and 10. Essential resources such as number lines and counters, along with worksheets and a presentation, support the learning process. Key vocabulary terms including 'data', 'pictogram', 'counting', 'total', 'difference', 'add', 'most', 'popular', and 'least' are introduced, with vocabulary cards available for further clarification. The lesson begins with a recap of previous learning, emphasising the significance of the pictogram key and its role in representing different numerical values. Students explore vertical and horizontal pictograms, discussing the data presented and the relevance of the key, especially when it represents multiples of 5 or 10. Through partner discussions and teacher-led activities, children learn to calculate totals, compare quantities, and understand terms such as 'most popular'.
During the lesson, children engage in partner work to solidify their understanding of pictograms and practice interpreting data. They tackle questions that challenge them to identify the most popular items by visually assessing the pictograms or performing mathematical calculations. The lesson is structured to cater to different levels of competency, with activities ranging from simple data retrieval to more complex interpretation tasks. Children are encouraged to reflect on what they have learned and the skills they have used or found challenging. The plenary activity, 'Give me five', prompts students to consider what they have understood, the tools that aided their learning, and key takeaways to remember from the lesson. Differentiated worksheets are provided to support children working towards expected levels and those ready to explore greater depth in their understanding of interpreting data from pictograms.