Statistics - Make tally charts 2 - Worksheet
Maths Resource Description
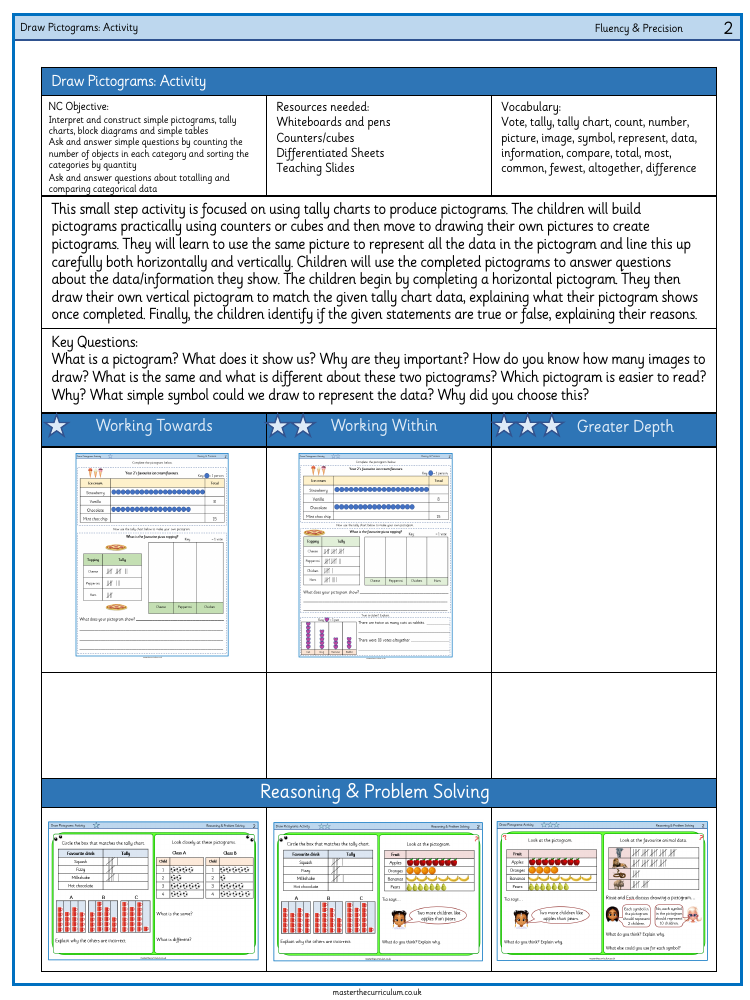
This worksheet, aimed at enhancing fluency and precision, is a practical exercise in creating and interpreting pictograms. It supports the National Curriculum objective of utilising tally charts to produce pictograms, an essential skill for Year 2 students. The activity requires a variety of resources, including whiteboards, pens, counters or cubes, differentiated sheets, and teaching slides to facilitate learning. Students will use these materials to construct pictograms, starting with a hands-on approach by arranging counters or cubes, before progressing to drawing their own pictograms. The lesson's vocabulary covers key terms such as 'vote', 'tally chart', 'count', 'number', 'picture', 'symbol', 'represent', 'data', 'information', 'compare', 'total', 'most', 'common', 'fewest', 'altogether', and 'difference'. These terms are crucial for students to understand and accurately describe the data represented in their pictograms.
The worksheet guides students through various activities, beginning with the creation of a horizontal pictogram, followed by a vertical one that correlates with a given tally chart. These exercises help students to visually represent data and to understand how symbols can stand in for quantities. They are encouraged to consider the clarity and readability of their pictograms, ensuring that symbols are lined up correctly. The worksheet also poses reflective questions to stimulate critical thinking about the data shown in the pictograms, such as identifying the most and least common items and explaining the reasoning behind true or false statements. This structured approach not only reinforces the concept of pictograms but also cultivates analytical skills in interpreting and presenting information clearly.

