Statistics - Draw pictograms - Starter
Maths Resource Description
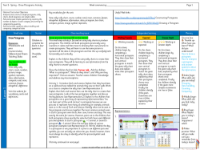
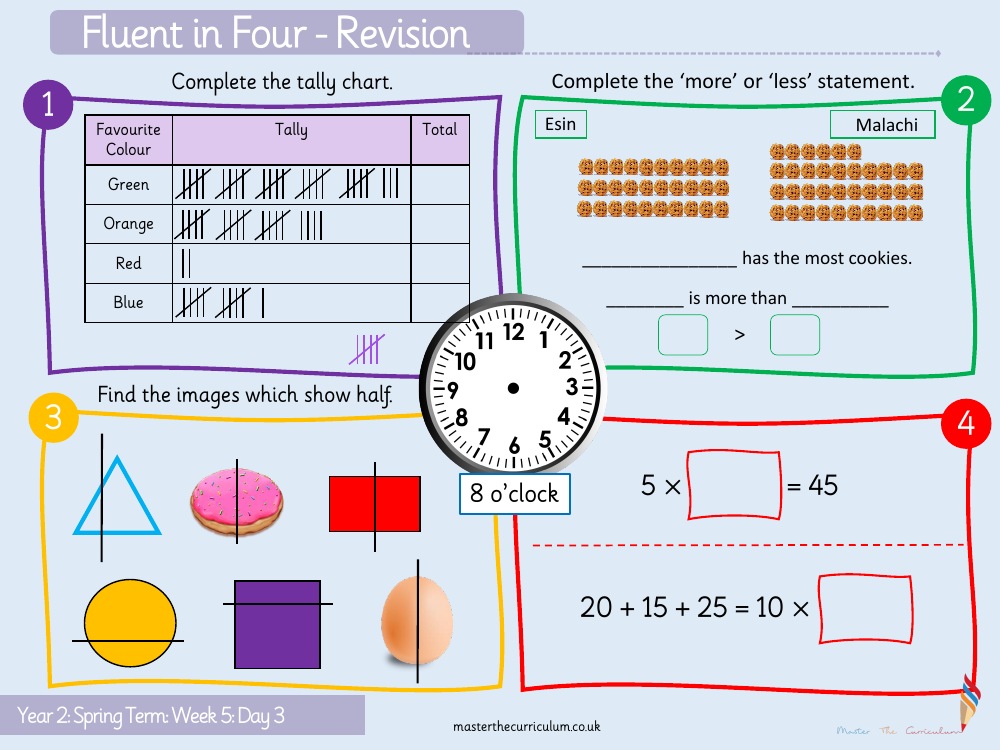
This educational resource is tailored for Year 2 students, and is part of their Spring Term curriculum, specifically for Week 5, Day 3. The lesson begins with a 'Fluent in Four - Revision' segment, which includes a series of arithmetic problems designed to test and enhance the students' fluency in mathematics. For instance, students are asked to solve equations such as '20 + 15 + 25' and to find a number that, when multiplied by 10, yields the sum of these numbers. Additionally, they must determine what number, when multiplied by 5, equals 458, and identify the time on a clock as 8 o'clock or 459 o'clock.
The lesson also includes activities to develop the pupils' data handling skills. They are tasked with completing a tally chart that records the number of votes for favourite colours, such as green, orange, red, and blue, and then calculating the total for each. To further their understanding of comparisons, students are asked to complete statements that involve 'more' or 'less', helping them to compare quantities and identify which has the most or least. For example, they might need to fill in the blanks to state which person has the most cookies or to compare two numbers using greater than or less than symbols. The lesson also encourages visual learning by asking students to find images that represent one half of a whole, thereby strengthening their grasp of fractions.

