Statistics - Draw pictograms - Planning
Maths Resource Description
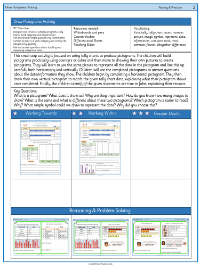
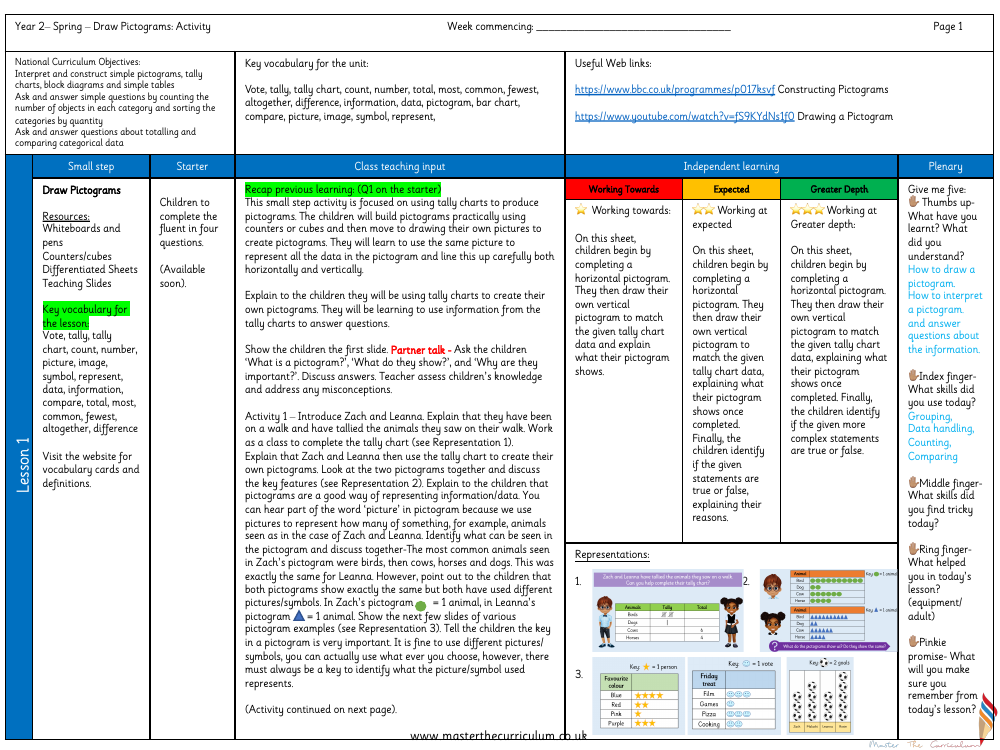
In this Year 2 Spring activity, students are introduced to the concept of creating and interpreting pictograms as part of their understanding of data representation. The National Curriculum objectives covered include constructing simple pictograms and tally charts, asking and answering questions about categorical data, and sorting categories by quantity. The key vocabulary for the unit includes terms such as 'vote', 'tally', 'count', 'number', 'total', 'most', 'common', 'fewest', 'altogether', 'difference', 'information', 'data', 'pictogram', 'bar chart', 'compare', 'picture', 'image', 'symbol', and 'represent'. The lesson begins with a recap of previous learning, where children use tally charts to build pictograms with counters or cubes, and then progress to drawing pictograms that accurately represent data both horizontally and vertically.
Throughout the lesson, the children are engaged in various activities that involve partner work and group discussions. They start by creating a pictogram to represent a class's favourite sport using physical counters or cubes, and then move on to drawing their own pictograms. The importance of including a key in the pictogram is emphasised to ensure clarity in what each picture or symbol represents. The lesson includes differentiated worksheets to cater to varying levels of understanding, from 'Working Towards' to 'Greater Depth'. The activities are designed to develop skills in grouping, data handling, counting, and comparing, with a focus on reinforcing the understanding of pictograms and their use in representing data. Common misconceptions such as miscounting tallies or misrepresenting data with incorrect symbols are also addressed to ensure a solid grasp of the concept.

