Statistics - Block diagrams - Starter
Maths Resource Description
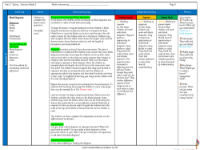
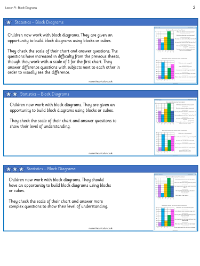
In today's statistics lesson, pupils will learn how to create and interpret block diagrams. These visual tools are used to present data in a clear and accessible way, using cubes or blocks to represent numerical information. The lesson encourages students to compare and contrast block diagrams with pictograms, prompting them to consider the similarities and differences between the two methods of data representation. Through engaging activities, students will be tasked with drawing block diagrams to showcase data on various topics, such as favourite colours and school subjects, using cubes to symbolise individual votes or preferences.
Subsequent activities involve collecting and analysing data from different classes on topics like house points and favourite sports. Students will be asked to construct block diagrams from the given data, ensuring they accurately label the diagrams and establish a clear scale. They'll also be required to answer questions based on their diagrams, such as identifying which class collected the most or fewest house points and calculating the difference in points between classes. Through these exercises, pupils will enhance their ability to work with statistical information and develop their reasoning skills by deciding which type of data representation is most appropriate for different data sets.

