Statistics - Block diagrams - Planning
Maths Resource Description
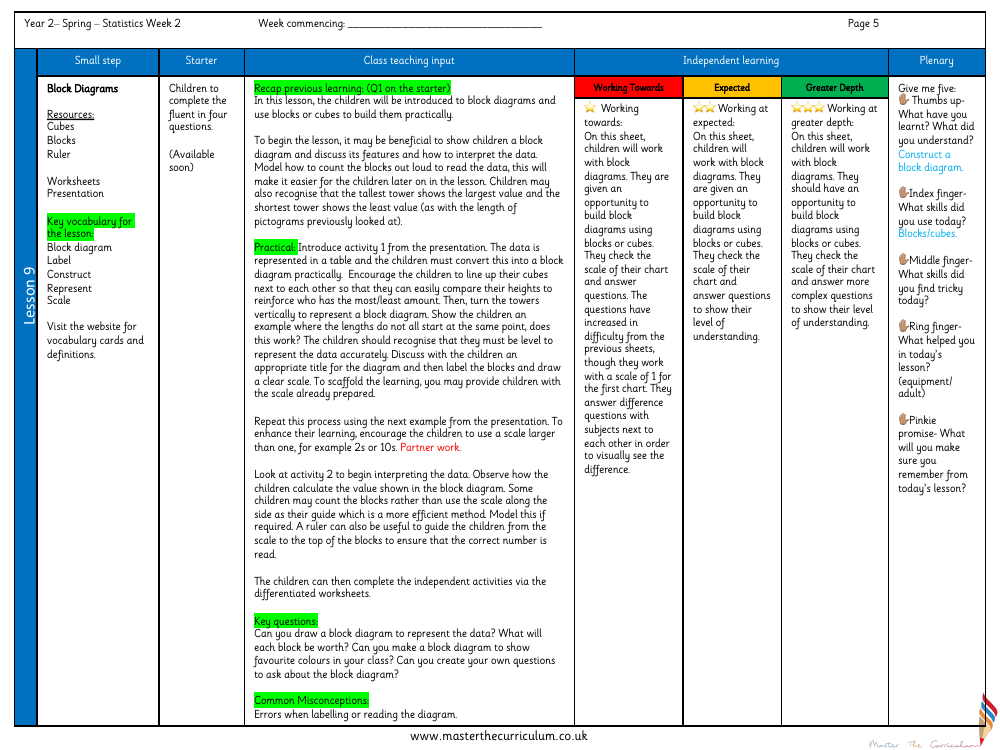
In the second week of Spring term for Year 2, students are introduced to the concept of block diagrams as part of their statistics learning. The lesson utilises practical resources such as cubes, blocks, and a ruler to help children understand and create their own block diagrams. Key vocabulary including 'block diagram', 'label', 'construct', 'represent', and 'scale' is emphasised, with supporting materials like vocabulary cards and definitions available to aid comprehension. The lesson begins with a review of previous learning, followed by a class discussion to familiarise students with the features of a block diagram and how to interpret the data it presents. Students are encouraged to build their own block diagrams using physical blocks, ensuring they understand the importance of aligning the blocks at a common starting point to accurately represent the data.
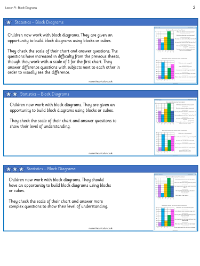
During the lesson, children work in pairs to construct block diagrams from tabulated data, with the option to use a scale larger than one to challenge their understanding. They are guided to label their diagrams correctly and to draw a clear scale, sometimes with the scale provided as a scaffold. The use of a ruler is introduced to help accurately read the values from the diagrams. Independent learning is facilitated through differentiated worksheets that allow students to apply their new skills. The plenary session includes reflective questions, where students consider what they have learned and identify any tricky aspects. The worksheets are designed to cater to different levels of ability, with the complexity of tasks increasing from working towards fluency to demonstrating greater depth in understanding, ensuring that all students have the opportunity to engage with and master the concept of block diagrams.

