Statistics - Interpret pictograms 2, 5 & 10 - Presentation
Maths Resource Description
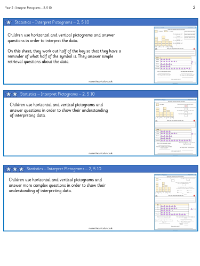
In a series of engaging activities designed to enhance students' understanding of statistics, the focus is on interpreting pictograms with keys representing 2, 5, and 10 units. The lesson commences with a discussion on the importance of a key in a pictogram, which serves to clarify the value each symbol represents within the graph. Following this, students are tasked with a variety of challenges that require them to apply their knowledge of pictograms. For instance, they are asked to compare the quantities of different birds, vehicles, and sports preferences, calculating totals and differences using the information provided by the pictograms.
Further activities prompt students to critically assess statements based on pictograms, determining whether they are true or false. These pictograms depict various subjects, such as the number of animals on a farm or the popularity of different sports. The exercises encourage students to think analytically about the data presented and to formulate their own questions that could be answered using the pictograms. Additionally, reasoning tasks require students to apply logical thinking, such as when evaluating the results of a traffic survey conducted by two characters, Zach and Tia, and when considering the sales of ice creams across different days of the week. The lesson concludes with independent work, where students answer questions about data presented in pictograms, fostering their ability to interpret and discuss statistical information.