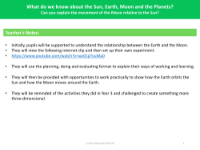
The movement of the Moon relative to the Sun - Graphs and diagrams sheet
Science Resource Description
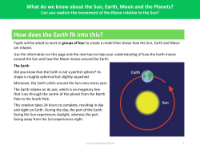
Graphs and diagrams play a crucial role in enhancing our understanding of astronomical concepts, particularly the changing shapes of the Moon that we observe throughout the month. These visual aids help to clarify why the Moon appears to alter its form, a phenomenon that can be attributed to its orbit around the Earth and the relative positions of the Earth, Moon, and Sun. By studying these illustrations, learners can grasp the cyclical nature of the lunar phases, from the new moon to the full moon, and all the intermediate stages. The diagrams typically illustrate the varying angles of sunlight reaching the Moon and how these angles affect the portion of the Moon that is illuminated and visible from Earth.
Understanding the movement of the Moon relative to the Sun is another concept that benefits from graphical representation. By examining diagrams that depict the Moon's orbit, students can better comprehend how the Moon's position in relation to the Sun changes over time, leading to the different lunar phases. These visual tools can also highlight the differences between the orbits of the Earth and Moon, and how these orbits interact with the Sun's position to create the regular pattern of lunar visibility we experience. The diagrams serve as a foundation for explaining the broader dynamics of the Sun, Earth, Moon, and the planets, and their interactions within our solar system.