Amount of daylight in each month
Science Resource Description
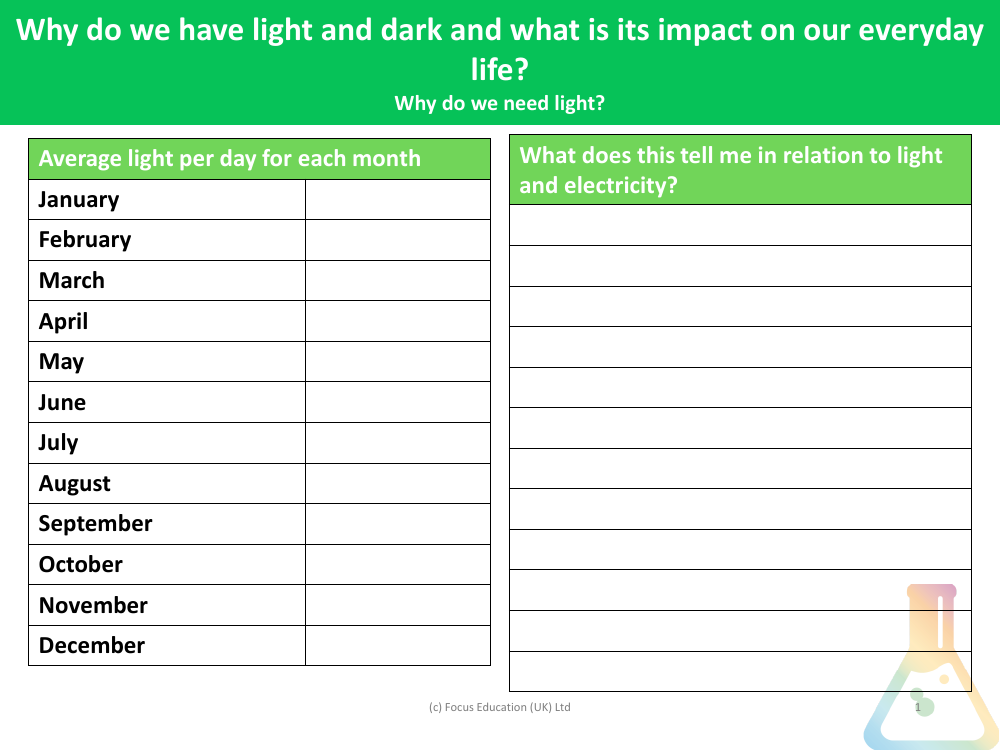
The amount of daylight each month, along with the average light per day for each month, varies significantly throughout the year. In January, the days are typically short, with the least amount of daylight, which gradually increases as we move into February and March. By April and May, the days become noticeably longer, peaking in June with the longest days of the year. Following the summer solstice, July maintains long daylight hours, which then begin to decrease through August and September. October sees a more pronounced reduction in daylight, which continues to dwindle in November and reaches its minimum again in December.
This variation in daylight has a direct correlation with our use of electric lighting. During months with limited daylight, such as January and December, there is a higher dependency on artificial lighting to illuminate homes, workplaces, and public spaces, leading to increased electricity consumption. Conversely, during months with extended daylight hours, like June and July, the need for artificial lighting diminishes, potentially reducing electricity usage. Understanding these patterns can help in planning energy consumption and considering the impact of natural light on our daily lives. Additionally, the presence of light and dark cycles affects our circadian rhythms and overall well-being, emphasizing the importance of light in our everyday existence.