Animal Food - Predator Prey Sheet
Science Resource Description
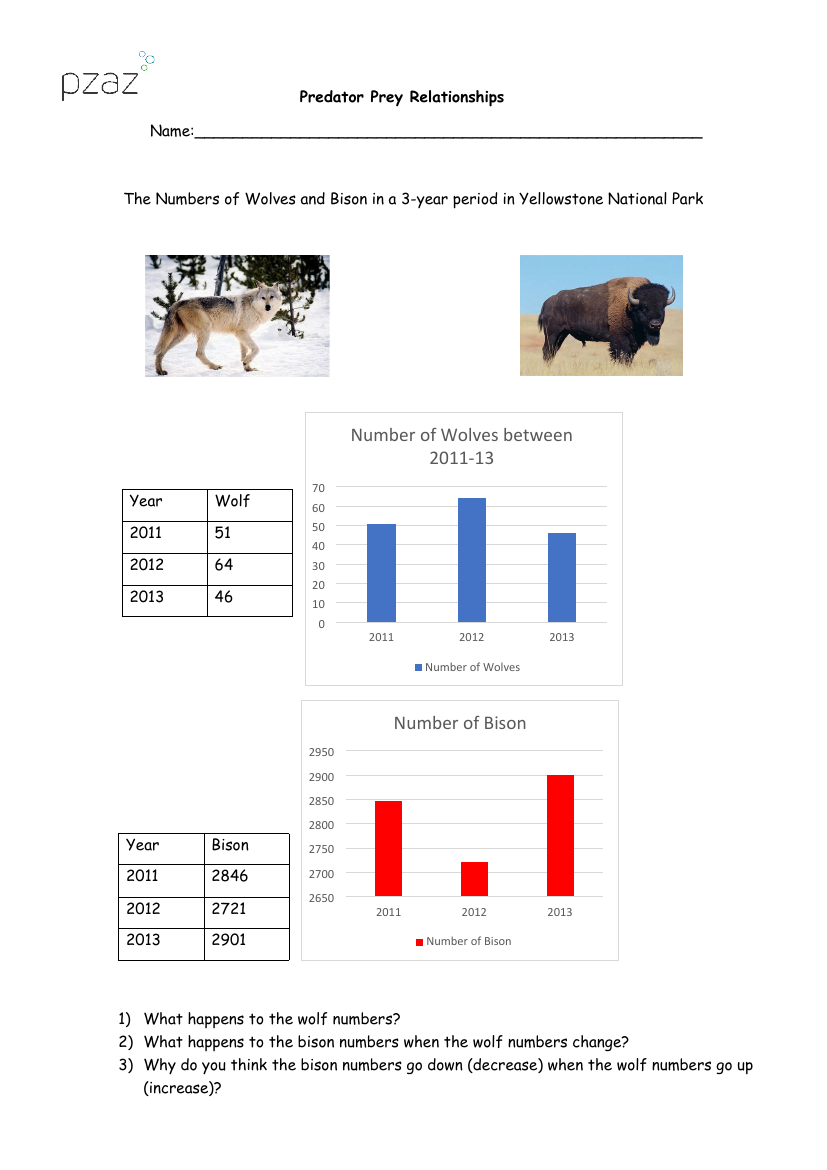
This worksheet invites students to explore the dynamics of predator-prey relationships using real-world data from Yellowstone National Park. It presents a table and corresponding graphs showing the fluctuations in the populations of wolves and bison over a three-year period. Students are prompted to analyze the data, noting the changes in the number of wolves from 51 in 2011, rising to 64 in 2012, and then decreasing to 46 in 2013. Similarly, they are asked to observe the bison numbers, which start at 2846 in 2011, decrease to 2721 in 2012, and rise again to 2901 in 2013.
The worksheet poses critical thinking questions aimed at understanding the interaction between these two species. Students must consider the reasons behind the observed trends, such as why the number of wolves might fluctuate and how these changes impact the bison population. They are encouraged to think about the natural cause and effect within an ecosystem, specifically how an increase in predators (wolves) might lead to a decrease in the prey population (bison). By examining the data and reflecting on these questions, students gain insight into the delicate balance of predator-prey relationships and the impact they have on the environment.