Max Maths, Year 3, Learn together, Bar graphs (2)

Maths Resource Description
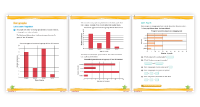
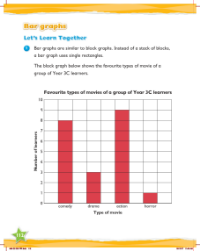
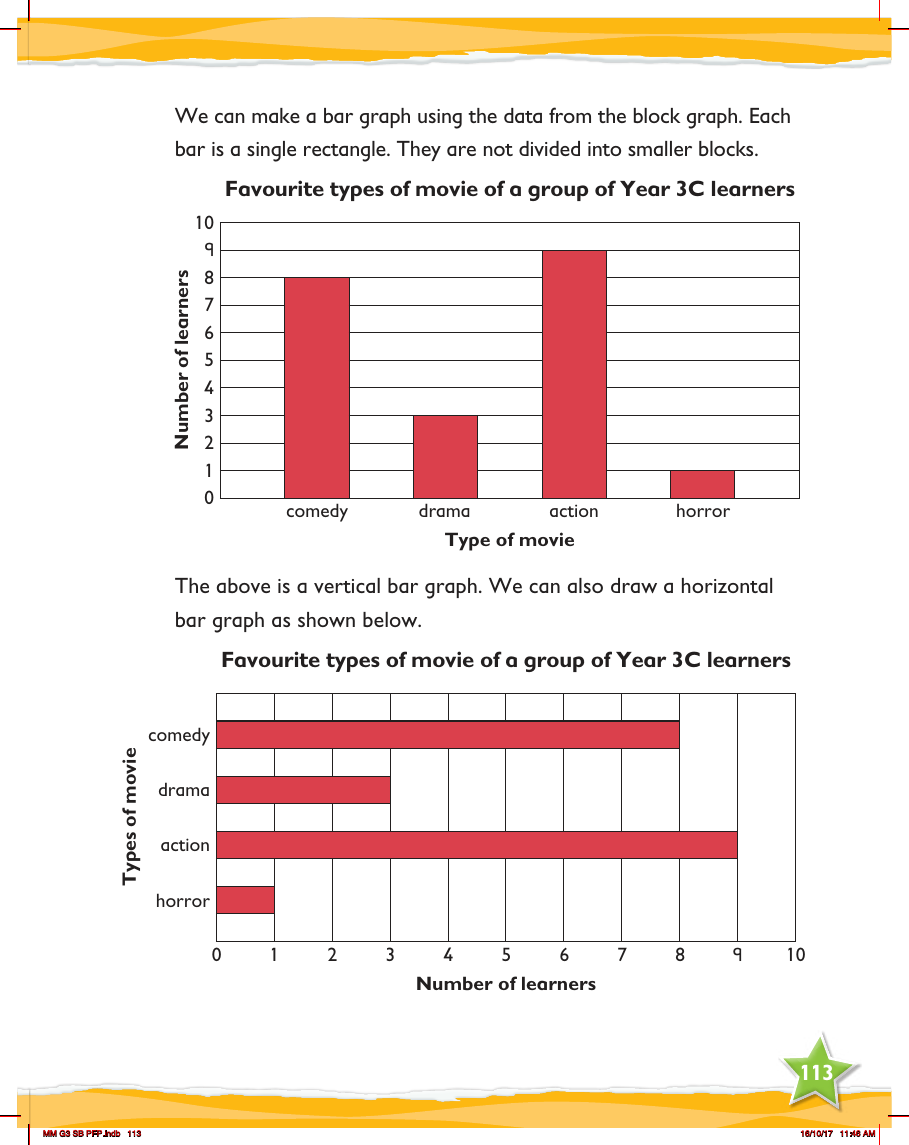
In the Max Maths Year 3 curriculum, students are introduced to the concept of bar graphs as a means of visual data representation. A bar graph is composed of rectangular bars, each representing a single data point without subdivision into smaller blocks. This lesson focuses on converting data from a block graph into a bar graph. For example, the favourite types of movies among a group of Year 3C learners are depicted in a vertical bar graph. In this graph, the types of movies—action, comedy, drama, and horror—are listed along the horizontal axis, while the vertical axis indicates the number of learners who favour each genre. Each bar's height corresponds to the popularity of the movie type among the students.
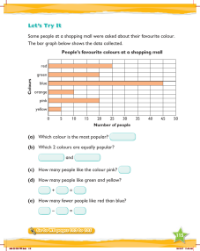
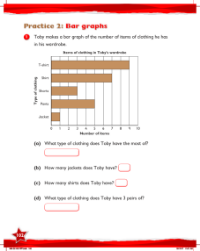
Additionally, the lesson explains that bar graphs can also be drawn horizontally. A horizontal bar graph illustrating the same data is presented, with the types of movies listed along the vertical axis and the number of learners along the horizontal axis. In both graphs, the length or height of the bar correlates to the number of learners who prefer that particular movie genre. These visual tools are fundamental in helping Year 3 students understand how to organise and interpret data effectively, as well as in recognising patterns and drawing conclusions from the information presented.