Max Maths, Year 3, Learn together, Bar graphs (1)

Maths Resource Description
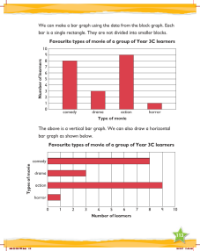
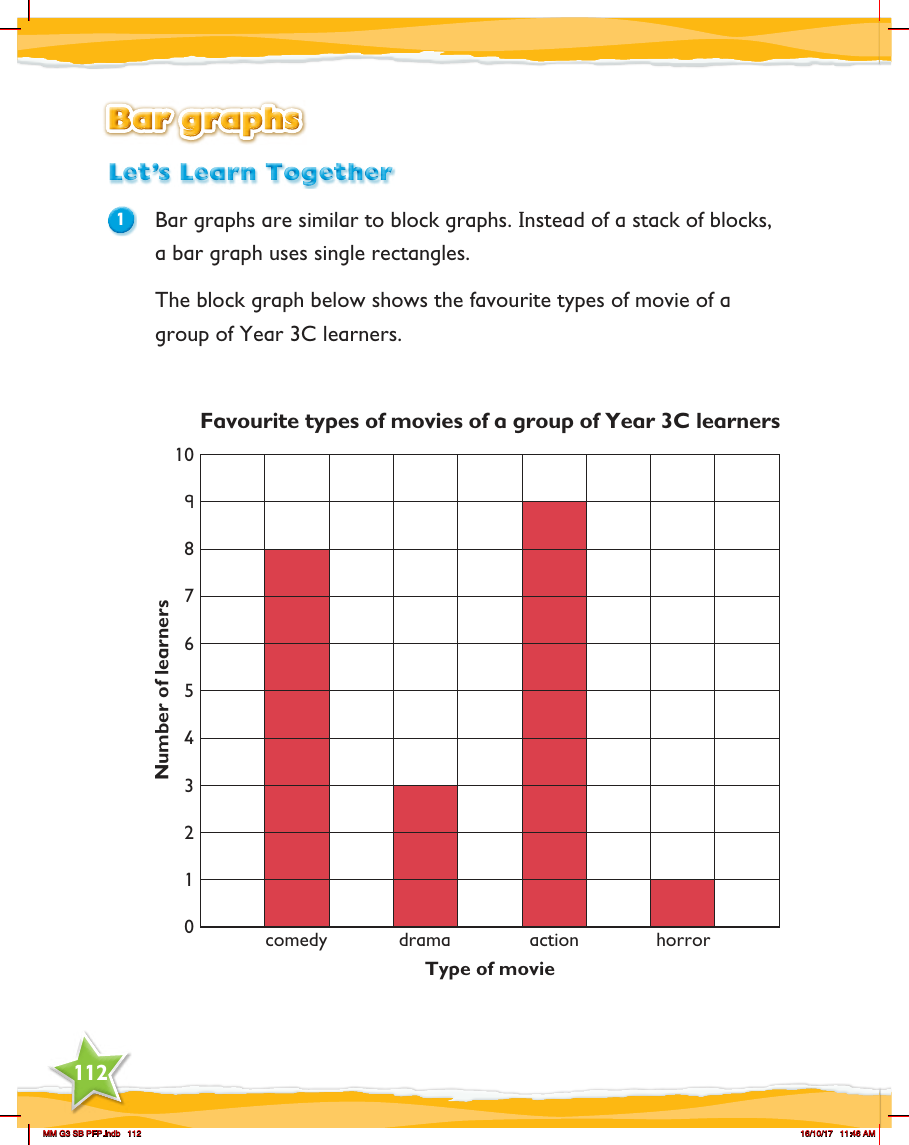
In the Year 3 curriculum, students are introduced to bar graphs, which are a step forward from block graphs they may already be familiar with. These graphs utilise individual rectangles to represent data instead of stacks of blocks. Bar graphs are a visual way to depict information, making it easier for young learners to understand and interpret data. For instance, a bar graph might be used to illustrate the favourite movie genres of a group of Year 3C students. Each bar's height corresponds to the number of learners who prefer a particular type of movie, such as action, comedy, drama, or horror, allowing for a quick and clear comparison of the popularity of each genre.
The lesson includes an example of a bar graph that details the favourite movie types among the students. The vertical axis of the graph represents the number of learners, marked with numbers ranging from 0 to 10, and the horizontal axis lists the different genres of movies. Each bar's height on the graph indicates the number of students who chose that specific genre as their favourite, providing a visual representation of the collective preferences of the class. This practical application of bar graphs not only helps students learn how to read and create such graphs but also encourages them to engage with data in a meaningful way.