Vocabulary - Statistics
Maths Resource Description
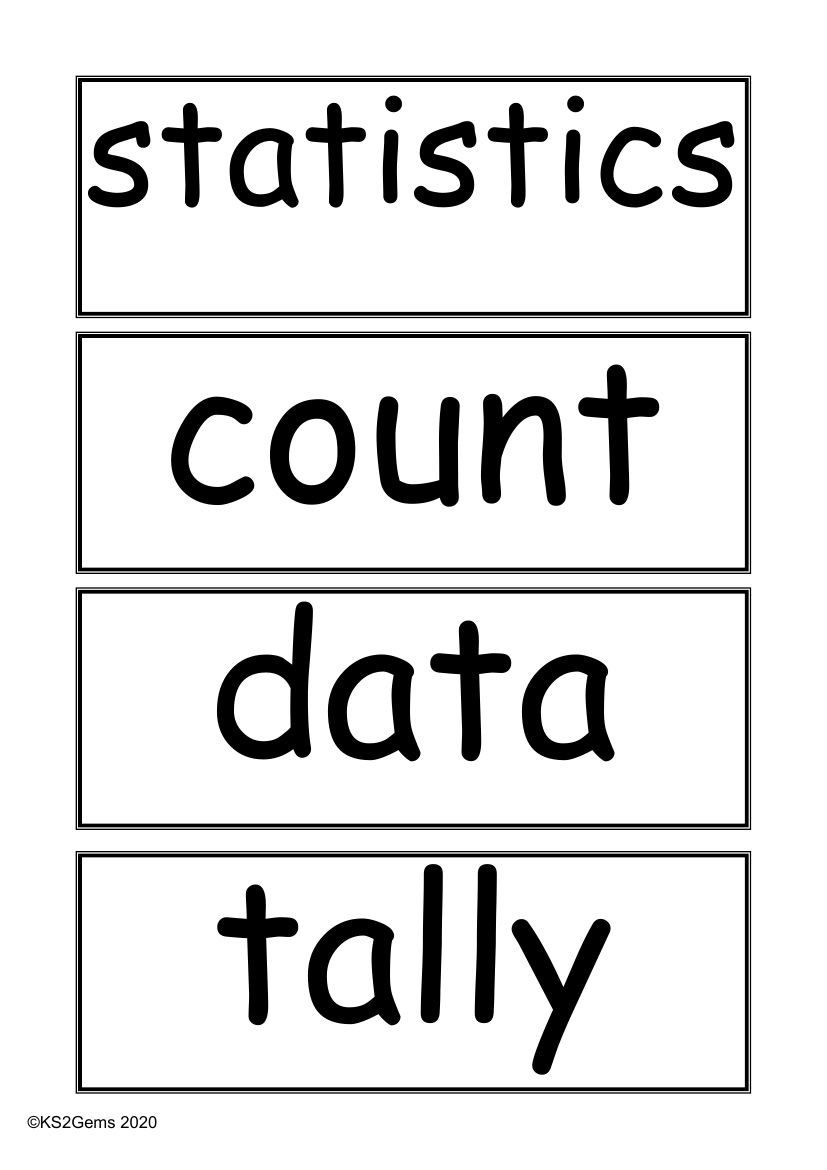
Statistics is a branch of mathematics that deals with the collection, analysis, interpretation, and presentation of masses of numerical data. It involves a variety of terms and concepts that are essential for understanding and working with data. Basic terms include 'count', which refers to the number of occurrences of a particular item; 'data', which is the information collected, often in numerical form; and 'tally', a method of keeping count by marking or noting down numbers. These concepts form the foundation of statistical analysis and are particularly relevant in the context of Key Stage 2 education.
When organising and presenting data, several tools and methods are used. 'Sort' refers to arranging data in a specific order, while 'graph' is a visual representation of data. There are different types of graphs, such as 'block graph' and 'pictogram', each serving a unique purpose in displaying information. A 'bar chart' is another common graph type, which uses bars to show the frequency of data, and it can be presented alongside a 'table' for a clear comparison of values. Other important terms include 'frequency table', which lists the number of times each value occurs; 'Carroll diagram' and 'Venn diagram', which are used to classify data; and 'line graph', which is typically used to display data that changes over time. Understanding these terms enables students to 'represent' data effectively and to 'interpret' the results to make informed decisions or conclusions.